

Building Better Scores For Embryo Screening
Building the highest quality genetic tests for families.

We’re excited to announce that we’ve just published a whitepaper that represents a substantial advance in parents’ ability to screen their embryos for a wide variety of diseases.
In this post, we provide a high-level overview of our results and show how our team at Herasight developed and validated polygenic risk scores (PGSs) for 17 diseases. The results demonstrate the potential power of this technology when high-quality, validated PGSs are available.
However, unless companies in this field properly validate their scores and are transparent with their methodology, it is difficult for consumers to know whether their results are meaningful and how they should interpret them.
If you're considering IVF or thinking about the future of reproductive medicine, our research demonstrates three key points:
Meaningful risk reduction is possible: Particularly for families with histories of diabetes, heart disease, or certain cancers, genetic screening can substantially reduce disease risk in your future children.
The technology is ready for embryo screening: Our within-family validation demonstrates that our predictors work for their intended purpose in embryo screening and that they achieve the best performance currently available on the market.
Methodology matters: Companies offering embryo screening differ dramatically in how effective their predictors are, how well they work across different ancestry groups, and how well they demonstrate their claims by using state-of-the-art validation methods.
Table of Contents
Our Whitepaper
What We Actually Measured
Polygenic scores (PGSs) use genetic data to predict an individual’s trait — e.g., their height, or the likelihood they will develop a disease — by adding up the effects of multiple genetic variants, often thousands to millions. Each variant typically contributes a tiny amount to the overall score. PGSs for disease are being investigated for potential clinical applications, including for making cancer screening decisions and for identifying people at high risk of cardiovascular disease.
PGSs can also be calculated for embryos before implantation, giving predictions for disease risks and traits that can be taken into consideration by couples when considering which embryo to implant. We built and validated a new set of scores for 17 diseases, ranging from type 2 diabetes and coronary artery disease to breast cancer and prostate cancer. If you are interested in a more in-depth discussion of how we built these scores, please see our whitepaper.
To understand what these scores mean in practice, let's use an easily measured trait: height.
Predicting a person's height without genetic information is difficult because it varies so widely. If you picked a random man, your best guess might be "average," but the actual range is huge. About 95% of men fall within a wide 12-inch range — for example, from 5'4" to 6'4".
Now, let's say we have a powerful PGS that can explain 50% of the total variation in height (in statistical terms, this means the predictor has an R² of 0.50). If the result of applying this PGS to a man results in a prediction (which is based solely on his genetic profile) of his “genetic height” as 6'0", we can make a much more precise forecast of his actual, physical height. By accounting for half of the uncertainty using the PGS, this shrinks his predicted 95% height range from a 12-inch window down to a much smaller 8-inch window (roughly 5'8" to 6'4").
This is why polygenic scores give probabilities of being a certain height or developing diseases, rather than predicting precise outcomes. Even with a high "tallness" genetic score, you might end up average height due to poor nutrition, illness, genetic factors not accounted for in the PGS, or random chance.
In contrast to height, we cannot directly measure one’s underlying risk of a particular disease, such as diabetes. Instead, scientists in the field use a statistical concept called liability, where individuals are modeled as having an underlying predisposition to diabetes on a continuous scale. Using this definition, people above a certain liability threshold develop the disease; those below do not.
The standard metric used to describe the performance of PGSs for binary traits like diseases is liability R² (or liability-scale R²), which measures how much of the variation in this underlying predisposition our polygenic scores capture. If our type 2 diabetes score has a liability R² of 20%, that means that our score is able to account for 20% of the differences in diabetes susceptibility between individuals1.
This framework lets us translate genetic scores into disease probabilities. Someone with a high polygenic score might have a 40% chance of developing diabetes, while someone with a low score might have just 10% — but neither outcome is certain, because the genetic factors captured by our PGSs account for only part of one’s risk.
PGSs are created by analyzing genetic data from thousands of people and looking across the genome for correlations between genetic variants and the outcome of interest. For applications in embryo screening, it is particularly important that these scores be carefully validated. The rough idea behind validating polygenic scores is to check your predictions for a set of samples that weren’t in your training data against the truth to get a sense of the accuracy of your predictions. For applications in embryo screening, you are predicting differences between potential offspring within a family. Therefore, to validate your scores properly for embryo screening, you should also test how well your scores predict outcomes within-family, which we detail further below.
How We Built Our Scores
Creating polygenic scores that work requires meticulous data curation and complex computational methods. Our approach began with data from genome-wide association studies (GWAS), which identify genetic variants linked to diseases by comparing the DNA of thousands of people. After extensive quality control and harmonization, we integrated data from numerous global sources, including FinnGen, the Million Veterans Program, and the UK Biobank.
The final output of this process are weights for a set of ~7.3M genome-wide variants for each of these diseases, which can then be applied to produce risk estimates for target individuals or embryos.
How Our Scores Performed
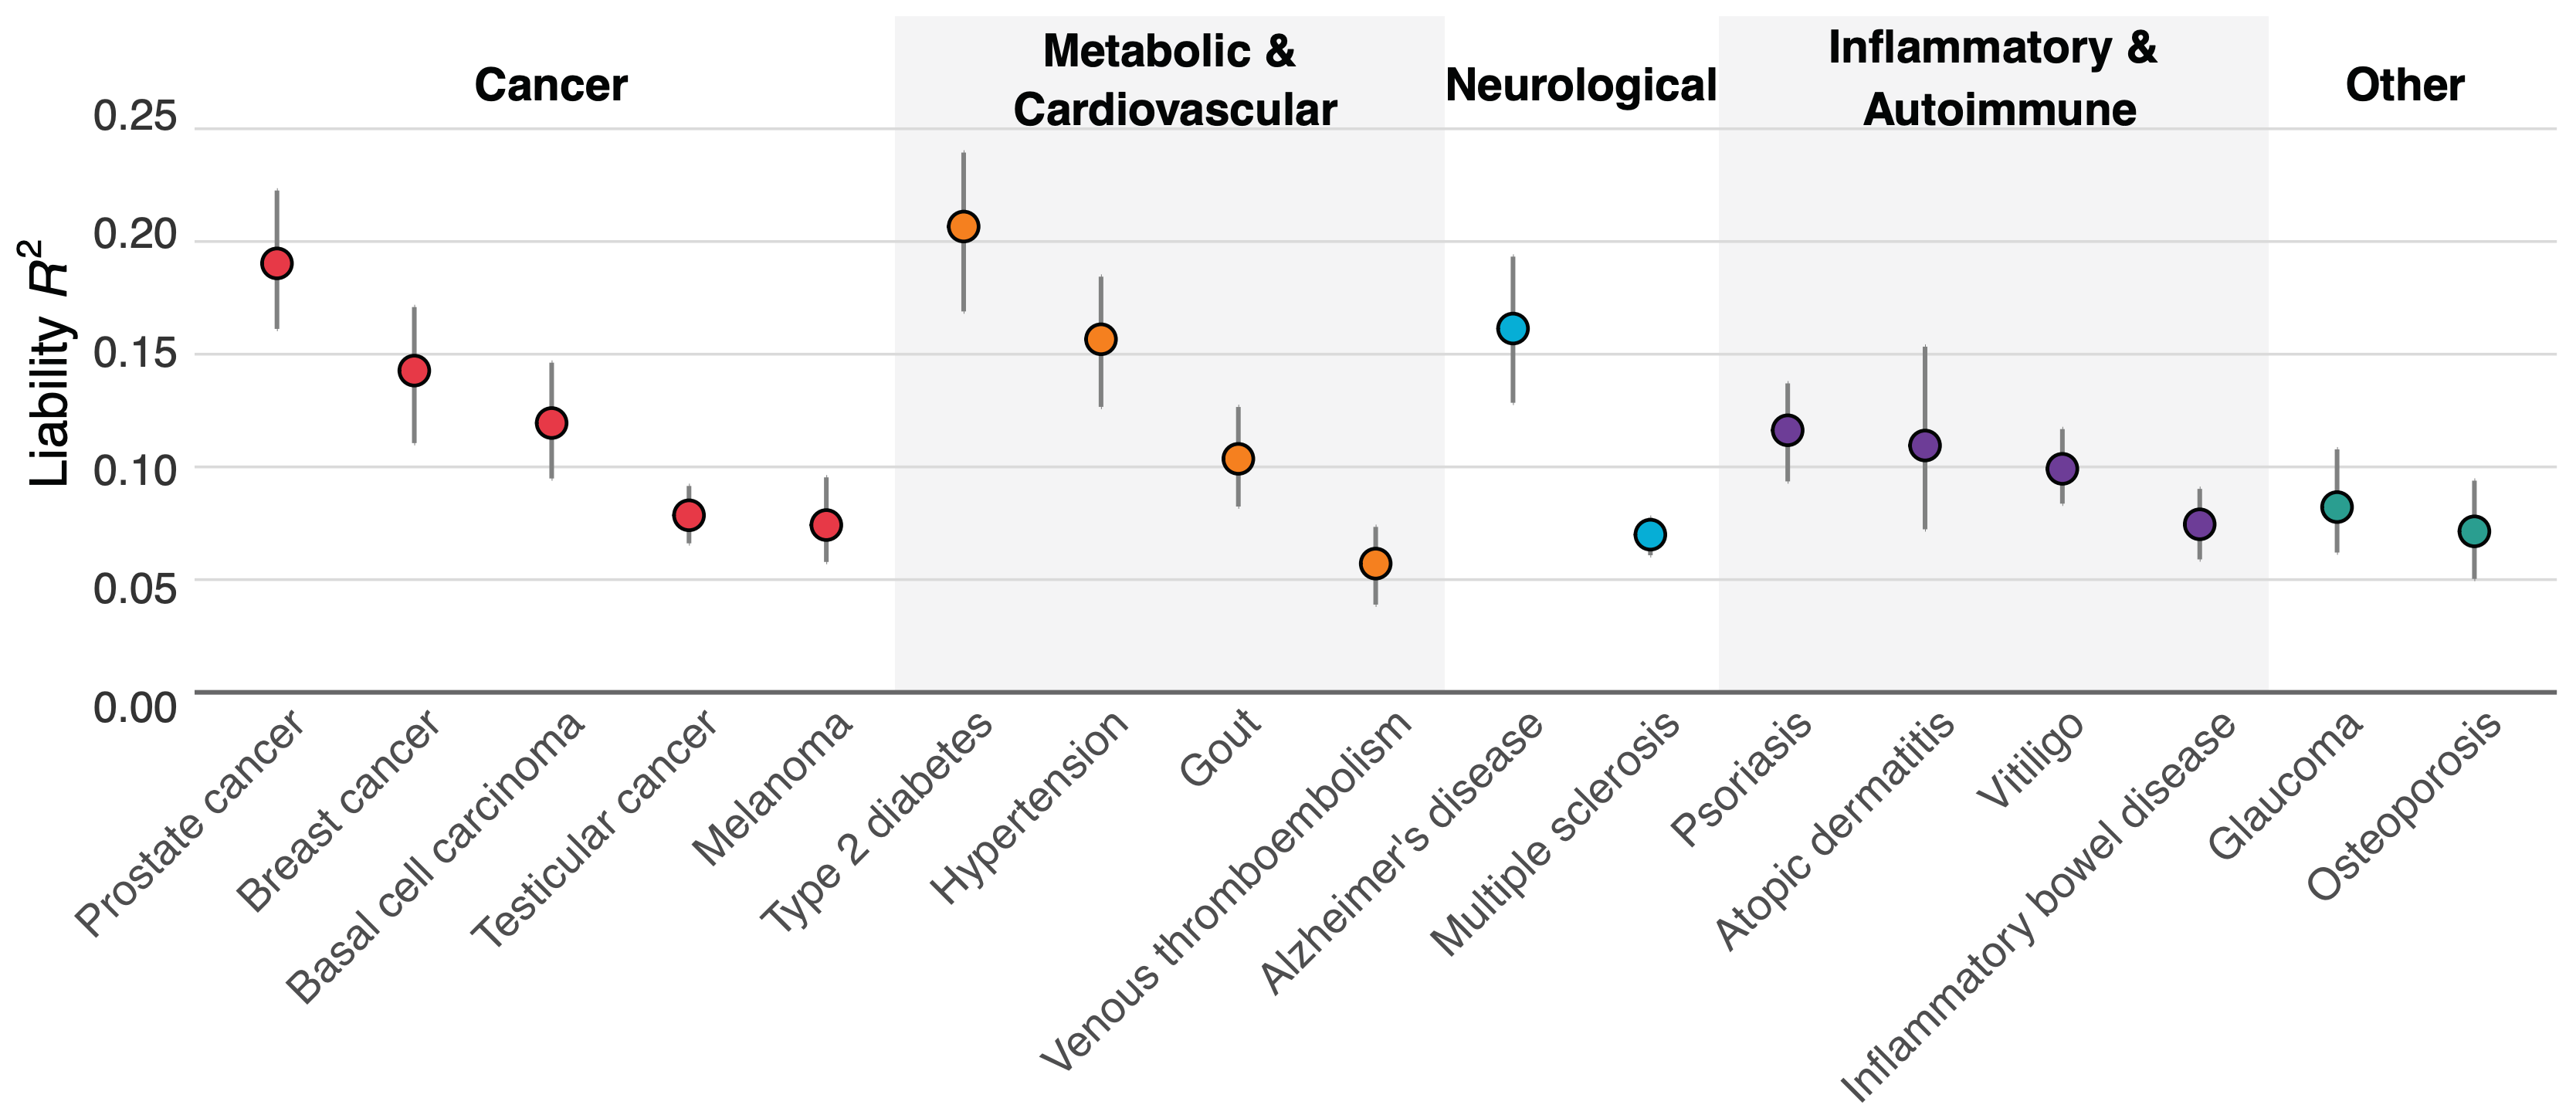
Figure 1 above shows how well our scores performed across 17 diseases. Type 2 diabetes, prostate cancer, hypertension, and Alzheimer's disease showed the strongest predictive power, with liability R² values exceeding 15%.
Why these particular diseases? One reason is that a good polygenic predictor requires huge amounts of data, and we had access to larger genetic datasets for conditions like diabetes (with ~250k cases and ~1.5M controls) and hypertension (~300k cases and ~560k controls) than for some other diseases. For Alzheimer's, there's one genetic variant (APOE ε4) that has an unusually strong effect, helping boost prediction accuracy.
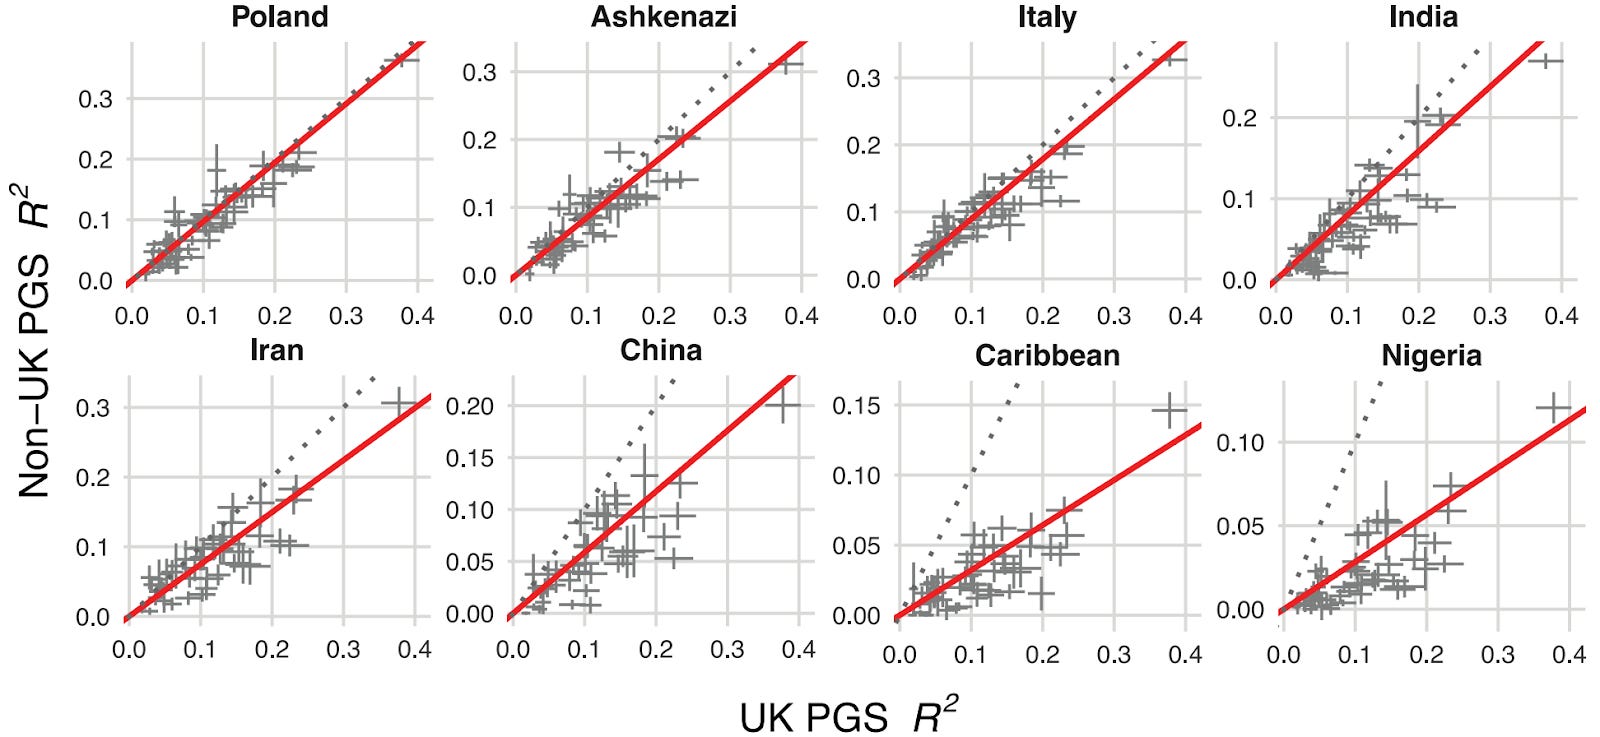
Addressing the Ancestry Gap
We confronted a well-known problem in genetics: prediction accuracy decreases for people from ancestries that aren’t well represented in existing biobanks2. Generally, predictive power declines in proportion to the genetic distance between the group a polygenic score is trained on (typically European ancestry) and the group in which you are predicting. Figure 2 below quantifies this decline across eight ancestry groups, benchmarking results against a group of white British descent.
This is a critical step in offering embryo screening commercially as predictions need to be calibrated based on the ancestries of the couple. However, other companies in this space have not published on the cross-ancestry calibration of their PGSs.
Our approach used functional genomic annotations (in other words, information about what genetic variants actually do downstream of the genome) to statistically emphasize the disease biology broadly shared between ancestry groups. This approach improved prediction across all ancestries compared to previous methods. And while gaps remain, particularly for African populations, we achieved meaningful progress in making our polygenic scores work better for everyone.
A Case Study: Type-II Diabetes (T2D)
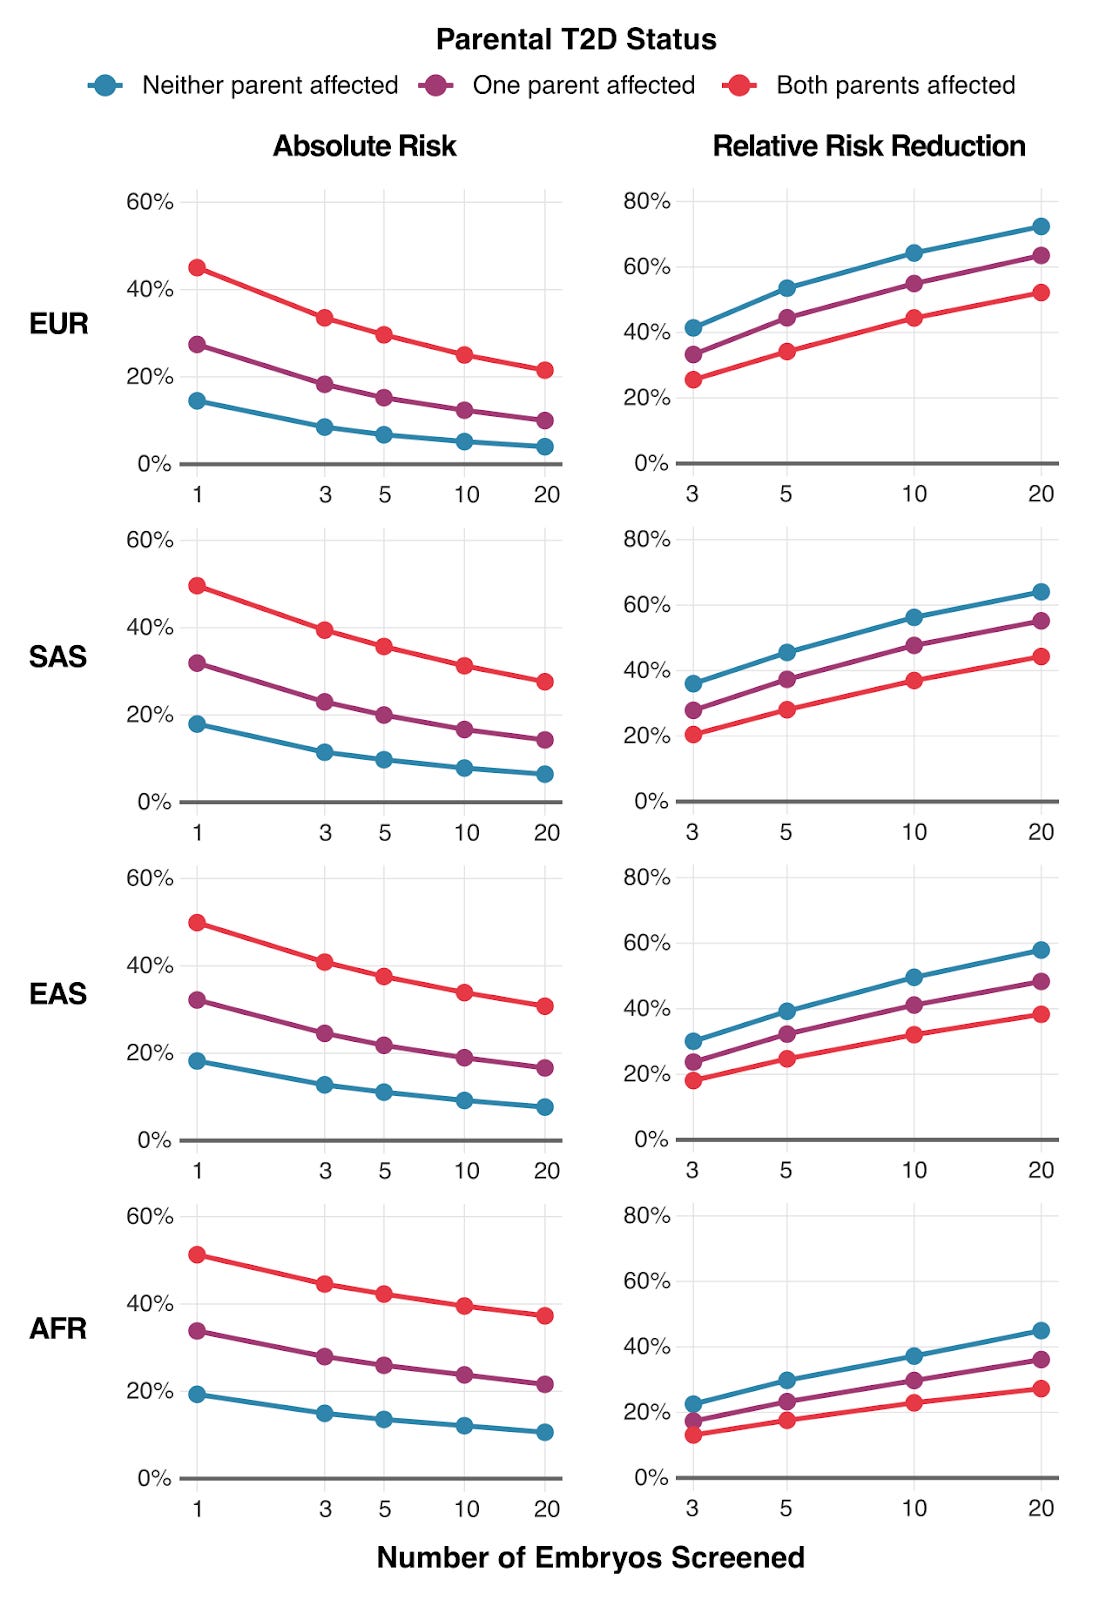
To illustrate the practical outcomes of our research, we modeled how much parents could reduce their child's type 2 diabetes risk through embryo screening. The results are shown above in Figure 3 — the impact varies by three factors: (1) the number of embryos available for screening, (2) parents' ancestry, (3) whether parents have diabetes themselves.
For a couple where both parents have type 2 diabetes, screening 10 embryos could reduce their child's absolute risk by 12-20%, depending on ancestry. That's the difference between a 50% lifetime risk and a 30-40% risk.
The Critical Step: Within-Family Validation
One aspect of what makes our work different from what’s out there is that we validated that our scores work within families, instead of just on population datasets of unrelated people. This distinction matters enormously for embryo screening because PGSs sometimes perform worse at predicting differences within-family — which is the relevant context for embryo screening — than at predicting differences between unrelated individuals because environmental and other factors that differ between families are removed. Therefore, only validating a PGS by predicting differences between unrelated individuals might give a misleading impression of how accurate your predictions will be for screening embryos.
For a continuous trait like height, the most intuitive approach to perform within-family validation is to test whether the PGS predicts differences in height between siblings. This design is almost identical to embryo screening because embryos are — from a genetic standpoint — siblings. So predicting differences between siblings is exactly like predicting differences between embryos.
However, this simple "sibling difference" model isn't powerful enough to analyze many diseases based on available data. In order to work around this data shortfall, we applied a method developed by Herasight team member Alexander Strudwick Young that reconstructs parental polygenic scores using only the genetic data from the siblings and parents3. This increases the power of the analysis, enabling us to obtain precise enough estimates of the prediction ability of our PGSs within-family for validation. To our knowledge, no one in the academic literature has within-family validation of PGSs for such a broad array of diseases.
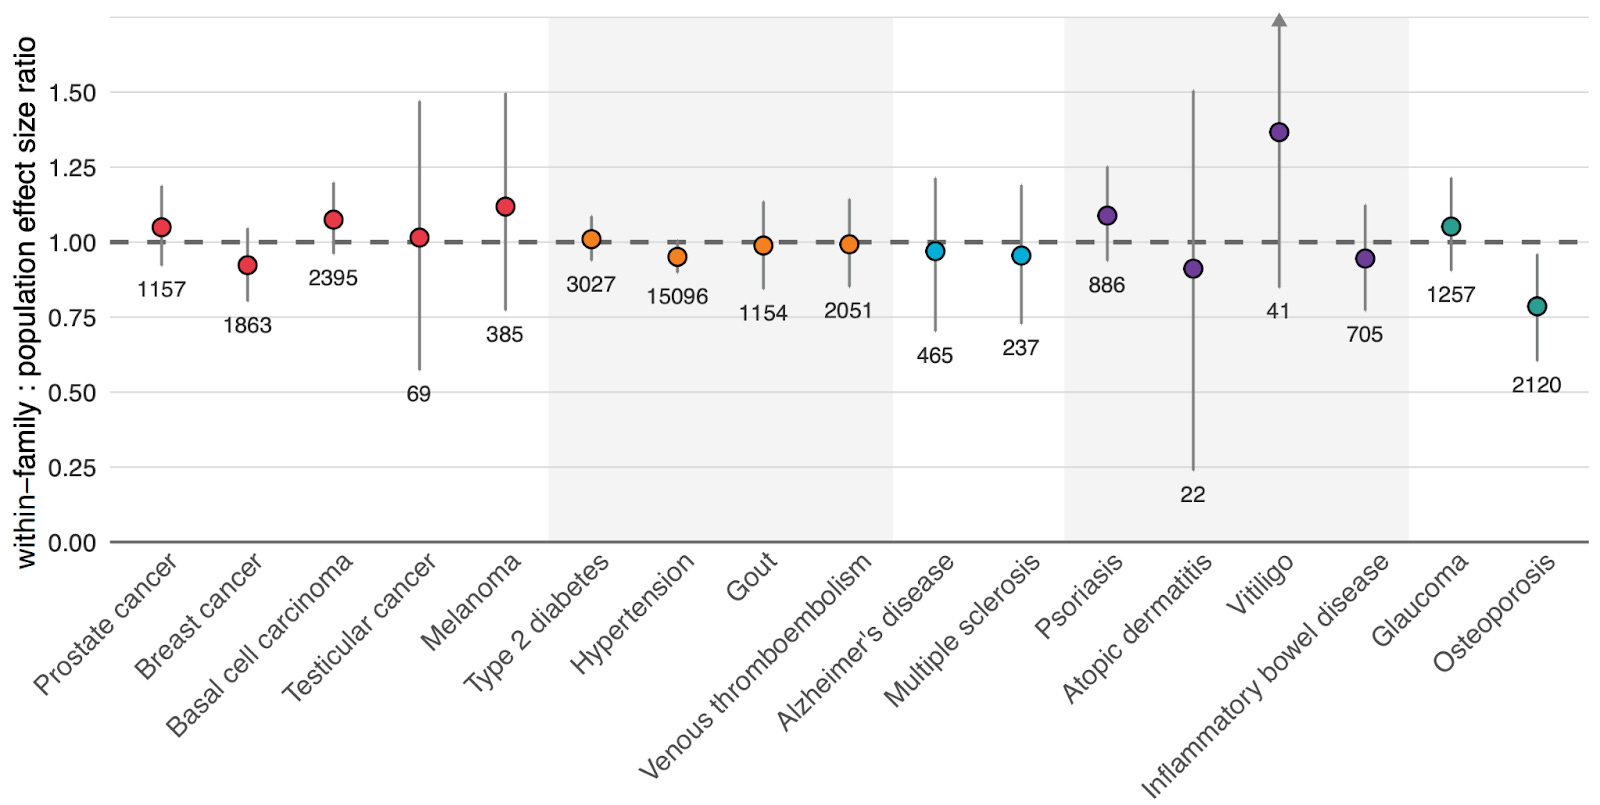
Figure 4 above shows our results. For 16 out of 17 diseases, our scores maintained their predictive power when tested with this within-family design.
Osteoporosis was our only outlier, showing reduced performance when validated within-family vs. at the population level, meaning that in practice, its predictive power has to be adjusted downward to reflect its true, direct genetic effect. These results highlight the importance of validating polygenic scores in the right context, and not just assuming that population performance will translate perfectly to risk stratification between embryos.
Comparing Our Scores Against Prior Academic and Commercial Research
When families consider using polygenic embryo screening, they may encounter two other companies: Orchid and Genomic Prediction (now operating as LifeView). We think families deserve transparent comparisons of their products based on performance data that they’ve published.
We analyzed published validation data from both companies and converted their reported metrics to liability-scale R² — the field's standard measure of the accuracy of polygenic scores — in order to compare our scores’ performance to theirs. In Figure 5 below, we show a comparison of our scores against those created by academic groups, and by Orchid and Genomic Prediction.
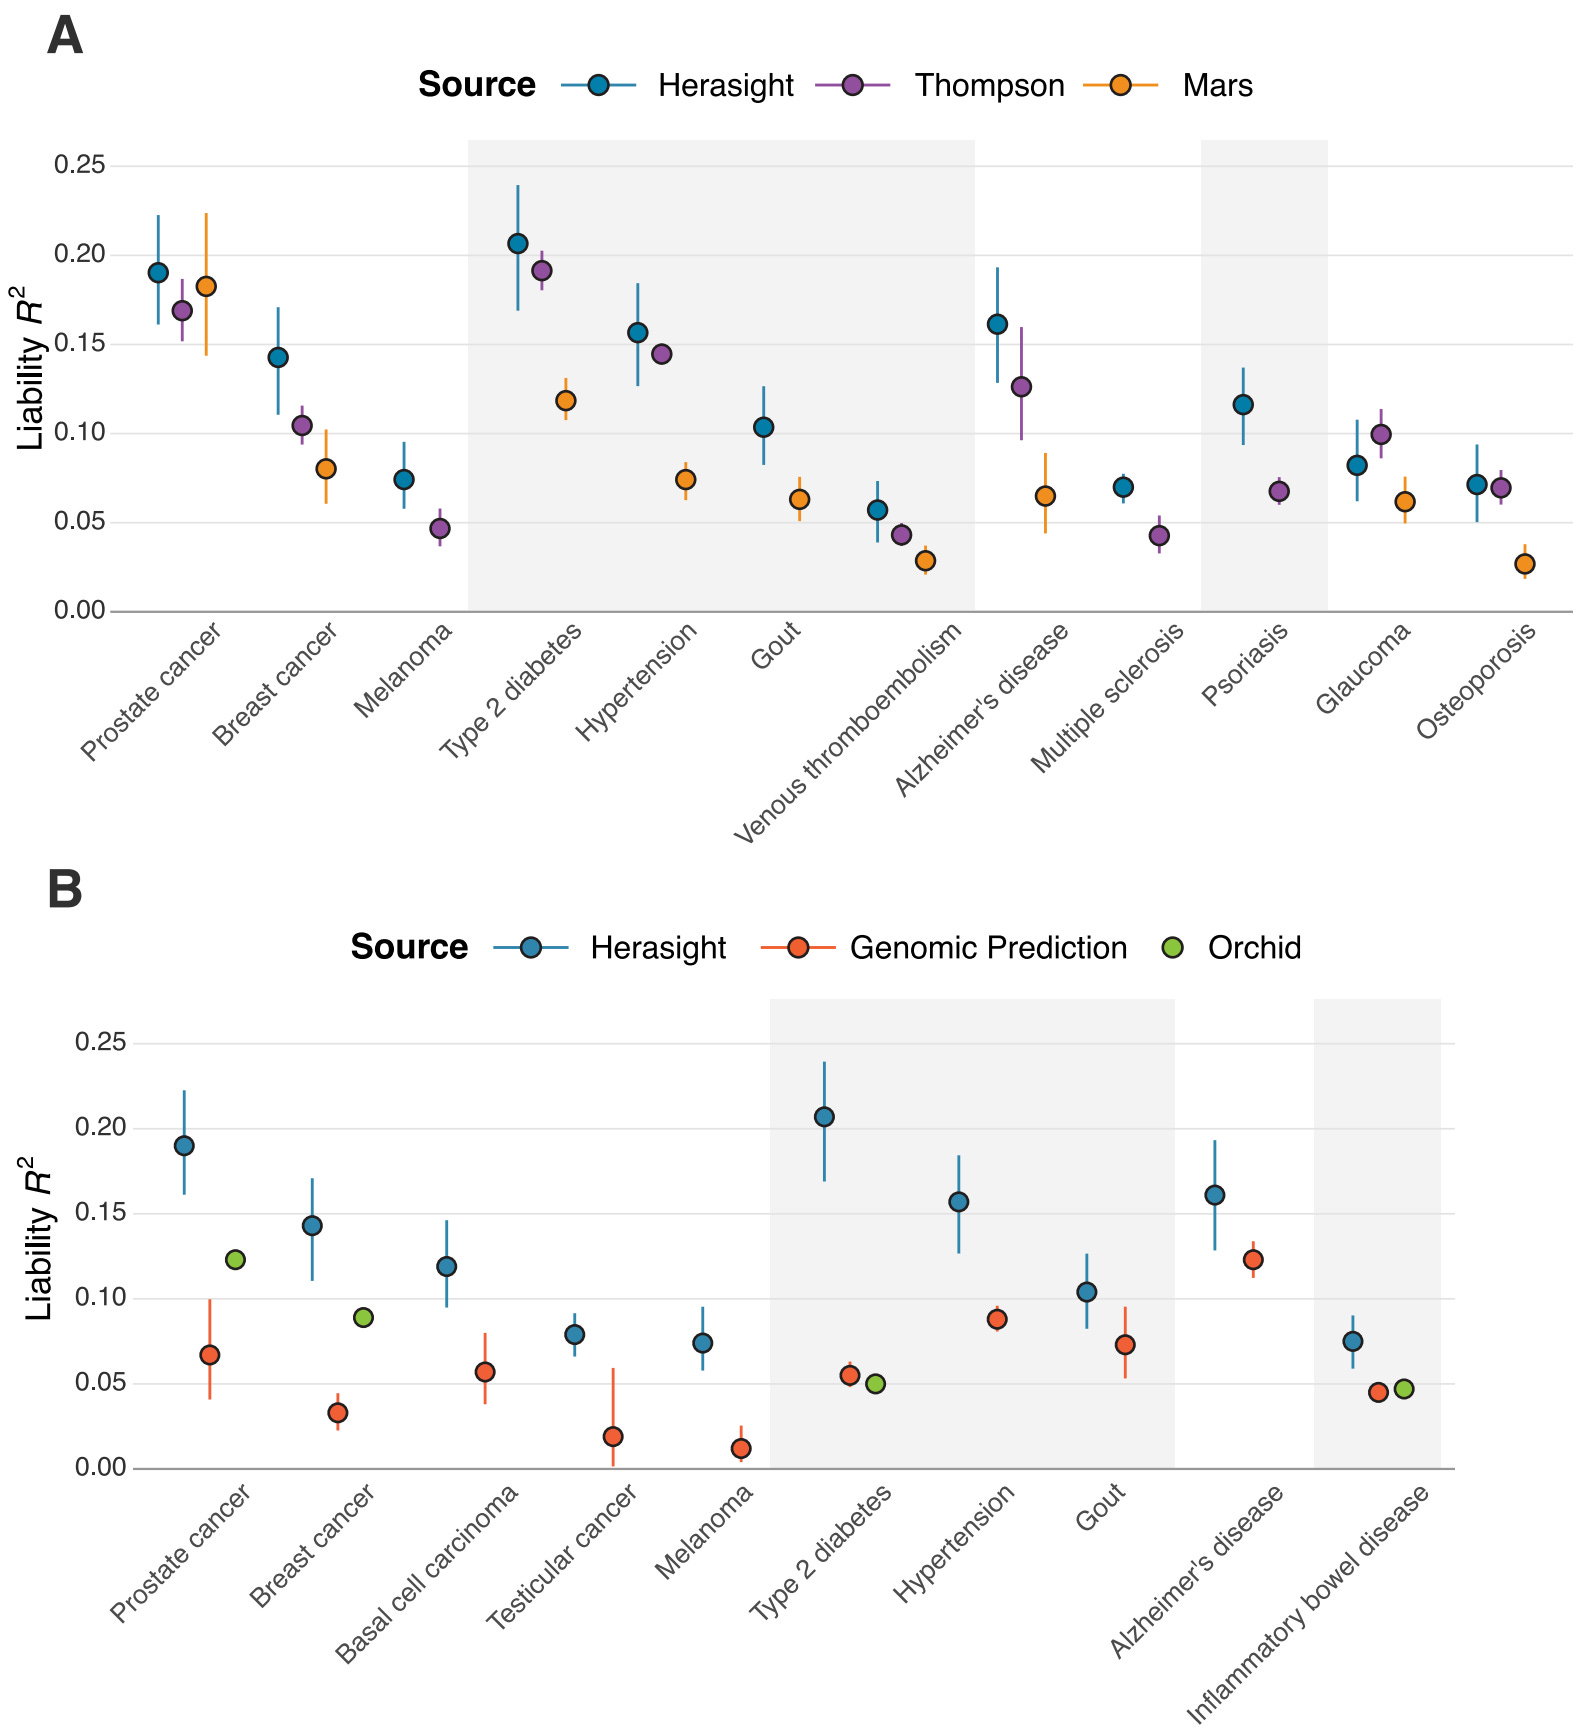
We found that our polygenic scores matched or outperformed all comparable scores, with liability R² values averaging 28% higher than leading academic scores and over 100% higher than other commercial offerings (specifically, our scores outperformed Orchid's by an average of 122% and Genomic Prediction's by 193%).
What makes these gaps even wider is the fact that these performance comparisons are restricted only to individuals with European ancestry. Neither Orchid nor GP, to our knowledge, publishes systematic validation across other ancestries. Given our improved cross-ancestry performance, the real-world advantage for non-European families using Herasight over other companies for embryo screening is likely to be substantial (see our whitepaper for more details).
These are not just minor technical advantages — rather, they represent substantial and considerable differences in how well these tests can actually predict disease risk. Lastly, our set of offered traits and diseases is substantially larger than what these competitors provide.
The Details Matter
Genomic Prediction’s Advertised Risk Reduction Numbers Are Substantially Inflated
Genomic Prediction advertises specific risk reduction percentages on its website4, but a closer look at their methodology reveals that these figures appear to be substantially inflated and based on a flawed validation approach: the basic idea is that the risk reduction figures they advertise seem to be based on comparisons in a different setup than the one relevant for embryo screening5:
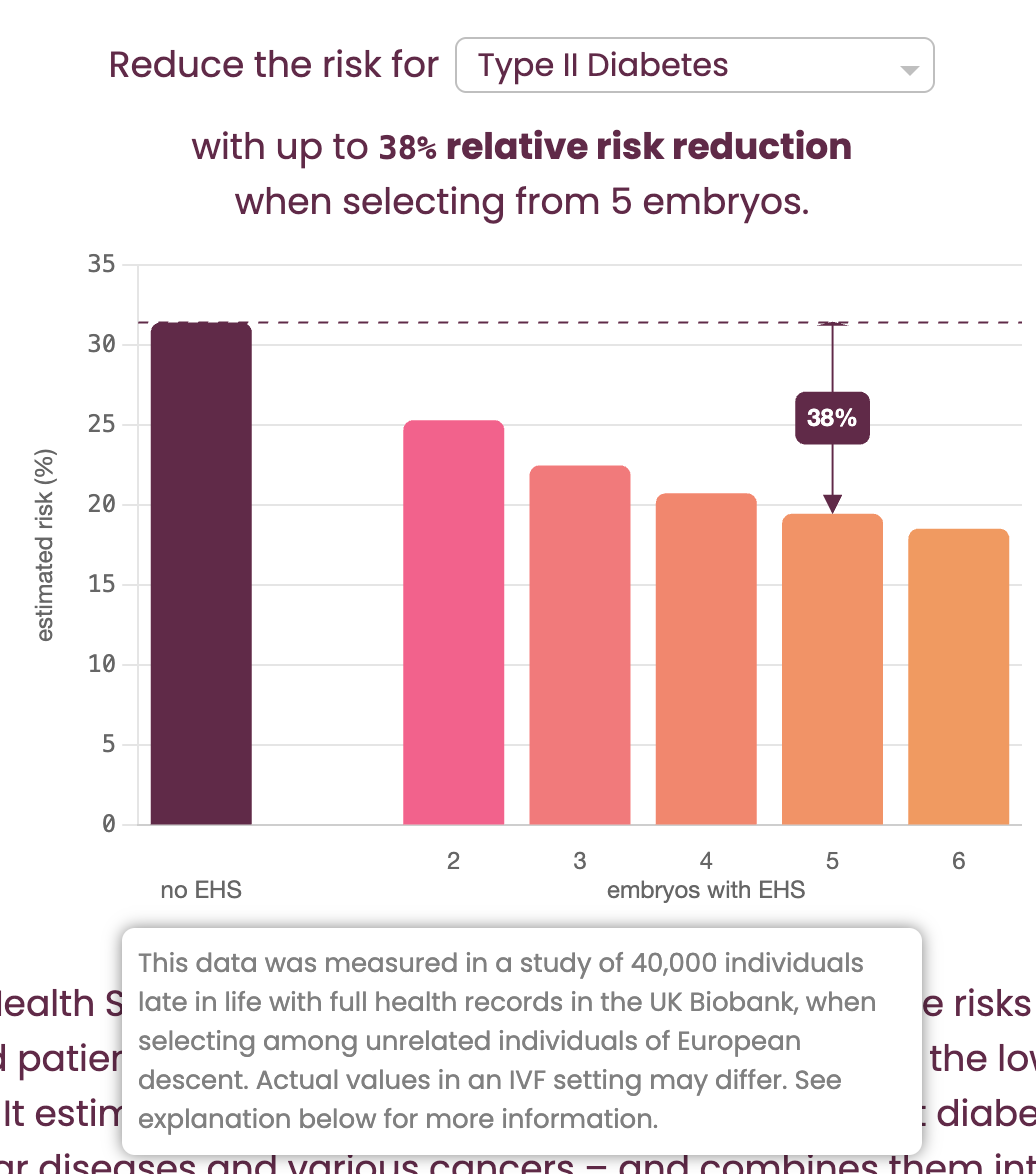
Their "Risk Reduction Calculator" (shown in Figure 6) claims to show the benefit of “selecting from 5 embryos.” However, the fine print (revealed in a mouseover tooltip) clarifies that the calculations are actually based on "selecting among unrelated individuals": this is the critical bait-and-switch.
The genetic variation between siblings from the same two parents is substantially lower (around ½) than that between random individuals in a population, which means that for the same polygenic score, you will get substantially higher risk reductions in the latter setup than in the former. But in the context of IVF, the relevant scenario is always selection between siblings.
Further down the page, GP obliquely acknowledges that “...one can expect somewhat smaller risk reductions in an IVF setting than illustrated in the calculator” shown in Figure 6, due to this decreased variation6. But how much is “somewhat smaller”? By using a similar back-calculation as we previously described, we calculated that the estimate of expected relative risk reduction for the T2D example pictured above (38%) is inflated by a factor of approximately 1.4 (or 40%!)7 compared to the value for actual within-sibling selection (which is closer to 27%). If we were to apply this flawed logic to our own predictors, we too would achieve dramatically inflated, but misleading, results.
Basing risk reduction calculations on unrelated individuals, instead of on siblings, fundamentally misrepresents the potential benefit of embryo screening. These details matter because they reveal how easily performance metrics can be inflated through methodological choices, which is exactly why rigorous, transparent validation is so important.
Orchid’s Reported Performance for Alzheimer’s and Other Traits is Misleading
Sometimes the most revealing issues hide in technical footnotes. Consider Orchid's Alzheimer's disease validation. In their published whitepaper, they report impressive performance for their Alzheimer's score8. But buried in the methodology is a critical detail—they included age as a covariate in their model when calculating validation performance.
This might sound like a minor technical choice, but it is fundamentally misleading. Of course older people have higher Alzheimer's risk! Since Alzheimer’s is a disease that occurs in old age, and is not something that children get, including age in a validation model lumps together the ability of age (a non-genetic factor) to predict Alzheimer's with the polygenic score itself, resulting in a metric which overstates the PGS’s predictive power. It is analogous to claiming your genetic test predicts gray hair particularly well because you included age in the model — certainly the model will do well, but the vast majority of that signal will simply come from the fact that people get grey hair when they get older, and not the genetic score alone. As a result, the actual genetic component of Orchid’s Alzheimer’s risk prediction is likely far smaller than their headline numbers might suggest.
(7/31/25 Note: the text in Orchid’s whitepaper has been modified to add the AUC without covariates, seemingly after Orchid was made aware of this oversight by this article. Compare https://archive.md/1Es3n (version on 7/28/25) and https://archive.ph/3503m (version on 7/31/25).)
(7/31/25 Note: the following paragraph was added.)
Alzheimer’s is the one instance of this issue where Orchid does not provide an additional, more comparable performance metric. For coronary artery disease9, inflammatory bowel disease10, and Type 2 diabetes11, age is also included as a model covariate so as to inflate the published performance, but in these cases Orchid reports an additional metric, odds ratio per standard deviation of PGS, in a footnote as well. Here the magnitude of the misdirection is made apparent: if one were to accept the age-covaried estimate presented in the main text as legitimate, the corresponding liability R2 would be around 17.1% for the case of T2D, near that achieved by our model trained on nearly an order of magnitude more T2D cases. In contrast, using the comparable odds ratio metric, the model’s true estimated liability R2 is only ~5%!
(8/12/25 Note: Orchid defended their decision to include age as an additional predictor in their focal Alzheimer’s PGS performance comparisons in a comment to the Astral Codex Ten blogger Scott Alexander. This comment was posted in Open Thread 394 on 8/10/25. The following paragraphs were added in response.)
While Orchid’s whitepapers report other performance metrics besides AUC, their addition of an AUC without age as an additional predictor to complement the one first reported with age still suggests a willingness to present misleading results. This is because Orchid’s updated AUC sans age (.724) doesn’t also compare against the corresponding result from the source from which they previously drew the comparison AUC including age (.782) despite both results being reported in the same Table 3 of Escott-Price et al. To clarify things, the table below summarizes which results were and were not reported:
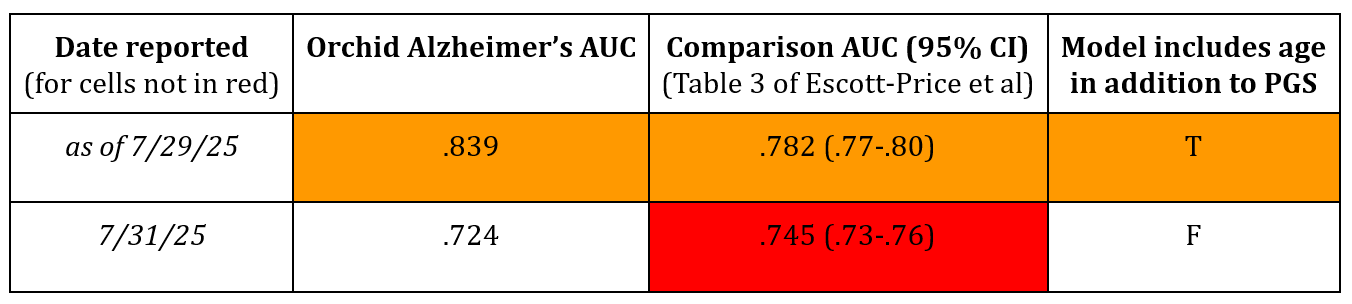
Following Orchid's update, this relevant comparison AUC (.745) still remains unreported in their whitepaper. This omission is likely because the comparison is unfavorable to their predictor's performance, as .724 is less than .745. The decision not to make the proper comparison contradicts Orchid's stated method that “to allow a head to head comparison, we used the same metric (AUC) and covariates as the paper we’re comparing against.” This misleading update thus again highlights the need for more transparent and honest reporting of PGS performances tailored to the embryo selection context.
The Necessity of Within-Family Validation
As a reminder, within-family validation of the scores themselves is ultimately what shows a PGS actually works for embryo screening. Here, the picture gets more concerning.
Orchid deserves credit for attempting within-family validation12, but they've only published results for a subset of their offered conditions (6 of the 12 diseases they offer) — what about the rest of them? Our own results show that it is vital to validate each score within-family. Just because there is no loss in signal within-family for a subset of traits does not mean that will be the case for all tested traits. Moreover, there are a lot of ways to construct a polygenic score, and it is still not fully evident how much different methods may lead to different within-family attenuation, even for the same condition. This underscores the need to validate specific scores within-family whenever it is possible to do so.
Genomic Prediction on the other hand claims that their screening “has been tested directly on about 20,000 sibling pairs with validated benefit.”13 However, their actual approach to within-family validation uses a highly non-standard methodology14 that attempts to quantify the ability of a PGS to distinguish between affected and unaffected siblings compared to random pairs of affected and unaffected individuals in their validation data, but whose interpretation in the context of providing actual risk predictions for embryos is unclear.
Additionally, in their primary validation paper from 202215, they test 20 scores in the context of a “polygenic health index” (which appears to be the “Embryo Health Score” commercially offered). The results, shown in their Figure 7, indicate that for 11 of the 20 diseases, the risk reduction of their PGSs in the context of their health index between siblings is not significantly different from 0 — essentially failing to demonstrate any benefit from the selection process for these diseases. In fact, in some cases, the point estimate was even negative. Despite this, their website indicates they still offer screening for many of these same conditions, including Breast Cancer, Inflammatory Bowel Disease (IBD), Melanoma, and Schizophrenia. In essence, they appear to be commercially offering tests that their own published data suggests do not work for the intended purpose of differentiating risk between embryos.
The Nucleus Problem: When Marketing Outpaces Science
People who follow preimplantation genetic testing may have noticed that in our comparison chart above we omitted Nucleus Genomics, a recent entrant into the field. Despite extensive efforts, we were unable to reconcile Nucleus’s publicly claimed performance estimates with established theoretical and empirical limits of polygenic prediction.
More specifically, due to the absence of published performance validations by Nucleus, we performed an independent assessment using publicly available documentation and a set of five physician reports16, made available to us with customer consent, which date up to June 2025.
During the course of our assessment, we discovered multiple inconsistencies in the way Nucleus seems to report results, including an apparently consistent and substantial overstatement of the predictive validity of the scores being used. Here we cover the high level results of our findings — for a full technical breakdown of our methods, see the Supplementary Note in our whitepaper.
The High Level
Our evaluation showed considerable variability in the composition of the polygenic scores (PGSs) provided by Nucleus. Nine of their disease PGSs appeared to be open-source models from the PGS catalog, a repository where researchers make pre-trained scores available. Almost all were from studies that were originally published five or more years ago. Other disease predictions relied on variant sets notably smaller than typically required to adequately capture polygenic signals.
For example, the polygenic score for attention-deficit hyper-activity disorder (ADHD) reportedly consisted of 12 variants, and a Parkinson’s disease score contained 50 variants. These variant counts fall substantially below conventional benchmarks for using PGSs to predict highly polygenic traits.
Most of the scores seem furthermore to be identical to scores used by Nucleus’s open source precursor Impute.me, implying that updates to their score set since the inception of the project as a for-profit business in 202217 have been limited, despite Nucleus’s assertion that their “guiding principle is to always provide the most recent, well-established, and predictive scores for each disease and trait.”18
Nucleus’s Claimed Performance Across Many Traits Is Substantially Higher Than That From an Independent Validation
We sought to validate Nucleus’s claimed performance for a subset of the scores they report which we were able to identify derived from the scientific literature (and so had publicly available weights). We did so by first characterizing Nucleus’s claimed performance on these traits by converting the results from the physicians’ reports we analyzed to the liability R² scale, and then comparing those to the liability R²s we obtained when we independently validated the very same publicly available scores in the UK Biobank, a population-scale dataset that includes phenotype and genotype data on nearly half a million Britons.
The basic idea here is that from the individual physicians’ reports that we analyzed, given the individual risk predictions (PGS Z-scores, reported absolute risk) and the baseline population prevalences reported, it is possible to back-calculate the implied liability R² of their scores, as they are mathematical transformations of each other.
Across the five customer reports, we noted substantial variability in the implied predictive performance, with, for example, schizophrenia having an implied liability R² ranging from 0.0 to 0.05.
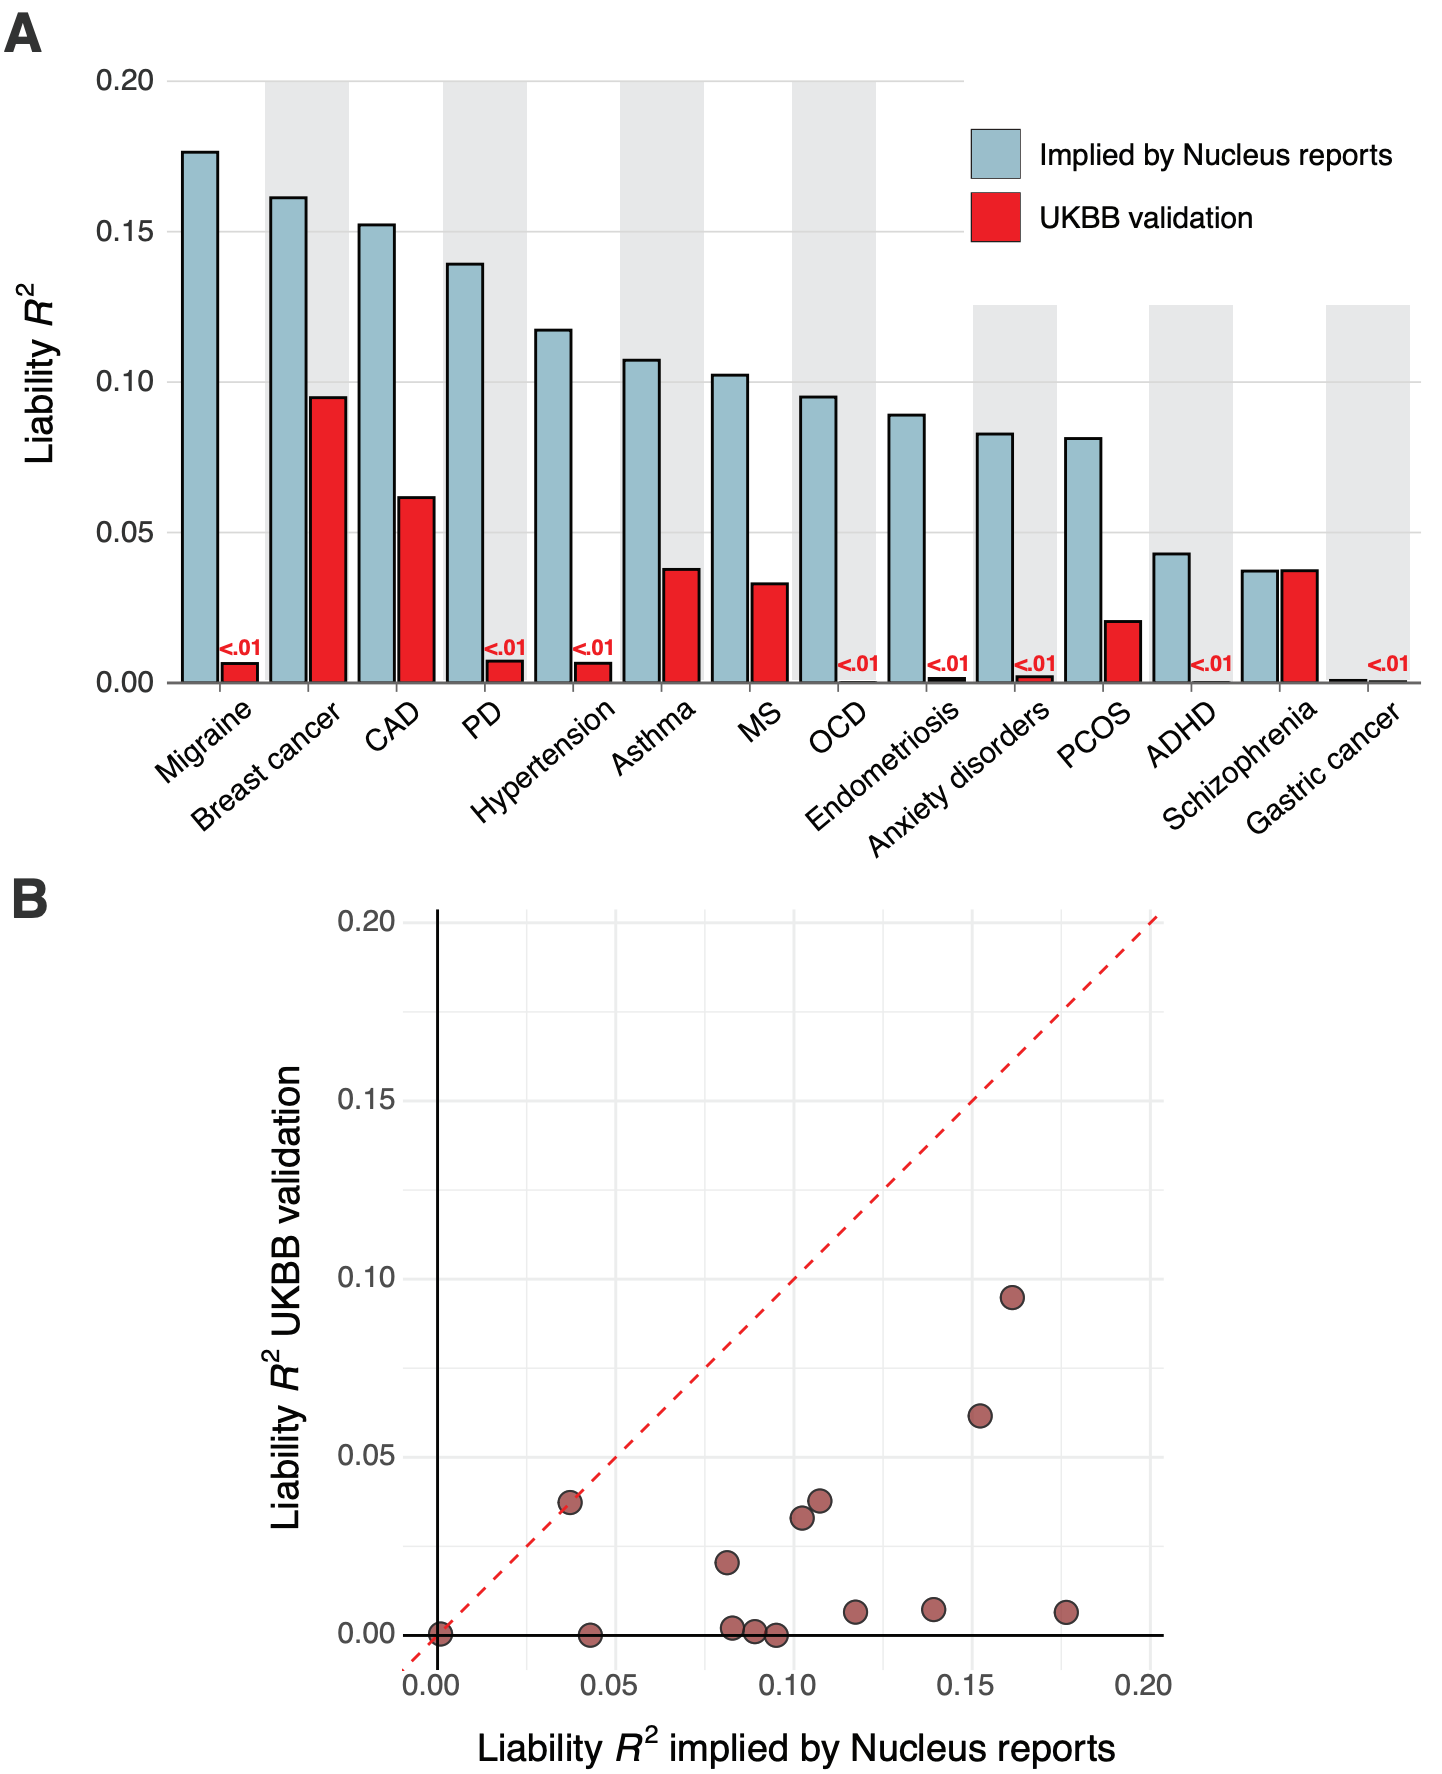
We found that for nearly all diseases, the median implied performance derived from Nucleus’s reports was consistently — and often substantially — higher than our independently validated performance estimates. Figure 7 above shows the liability R² values that Nucleus implicitly claims by virtue of their risk predictions side-by-side with the values from our independent validation.
Notably, we found literature-based performance estimates for Nucleus’ breast cancer19 and schizophrenia20 PGSs, and these were highly concordant with those from our own validation in the UK Biobank. This concordance suggests that our independent validations are consistent with externally conducted validations. Overall, we found that the PGSs likely used by Nucleus display substantially lower predictive performance than that implied by their customer reports, raising questions about the validity of their results.
An Example: Nucleus’s ADHD Score
In its physician reports, Nucleus describes a two-part analysis for ADHD. Our assessment indicates that both parts use scientifically questionable methodology.
The first part of their analysis examines the exome, listing 13 genes they deem relevant for ADHD: AUTS2, CRY1, FGD1, FOXP1, MBD5, MTNR1A, NAA15, NF1, NRXN1, SCN1A, SETBP1, SLC6A3, and SLC9A9. The scientific justification for selecting this specific set of genes is not provided. While each gene has a tangential link to neurodevelopment, the list omits many of the most robust candidate genes identified in current research. Most notably, it excludes KDM5B, which recent large-scale studies have established as the most significant gene associated with ADHD21. This curated list is therefore neither comprehensive nor reflective of the current scientific consensus.
More concerning is their polygenic score. Nucleus states it analyzes 12 single nucleotide polymorphisms (SNPs), which correspond to the genome-wide significant "hits" identified in the 2019 Demontis et al. genome-wide association study22. This "top hits" approach represents an outdated methodology. While these 12 variants have the strongest individual statistical link to ADHD, modern genetic science has demonstrated that they capture only a tiny fraction of the heritability for a highly polygenic trait like ADHD — indeed, per Demontis et al., “the 12 significant loci are compelling, but only capture a tiny fraction of common variant risk for ADHD.” Within the paper, Demontis et al. themselves rely on tens of thousands of variants to build a polygenic score, as true polygenic prediction works by aggregating the small effects from thousands, or even millions, of variants across the entire genome. Relying only on the strongest hits ignores the vast majority of the genetic information that determines an individual's risk.
Furthermore, even within this flawed framework, the choice of the 2019 study is questionable. A much larger and more powerful follow-up study by the same group was published in 202323, increasing the sample size substantially. The 2019 data appears to be a legacy artifact from Nucleus's open-source precursor, impute.me, suggesting the model was recycled without incorporating years of subsequent scientific progress—an eternity in genomics.
Given this background, we were surprised to see that the risk predictions in the Nucleus reports we analyzed imply that their model explains 4% or more of the variation in ADHD risk for their European ancestry customers. This level of performance is simply not plausible for a 12-SNP model; it is much higher than what state-of-the-art models achieve using millions of variants, around 1%24.
When we investigated this discrepancy by reconstructing their 12-SNP model and validating it ourselves using the UK Biobank, the results were clear: the score’s performance was statistically indistinguishable from random chance. It lacks any meaningful predictive power, let alone explaining 4% of variation, raising serious questions about the validity of the results provided to customers.
(8/1/25 Note: We have removed this section discussing Nucleus's reported scores and translation to absolute risk because of ambiguous wording that prevents us from making a definitive statement at this time.)
Conclusion
If you're considering embryo screening, our research clearly shows that you can meaningfully reduce disease risks and influence heritable traits using polygenic scores. This is true whether or not you have a family history of disease, but the gains can be especially large when you have a family history of a specific disease, such as breast cancer, diabetes, or schizophrenia.
Our within-family validation demonstrates that our predictors work for their intended purpose, and that they achieve the best performance currently available on the market. However, companies offering embryo screening differ dramatically in how well they demonstrate their claims by using state-of-the-art validation methods.
We are enthusiastic about the potential for embryo selection to improve population health and well-being. But without methodological rigor, it is easy to mislead people when making an important decision for their family. In the worst case, unsound polygenic scores give parents false hope while delivering the genetic equivalent of palm readings. Luckily, it is also easy to be transparent about the metrics and methodology used to produce customer reports, and we encourage anyone offering an embryo selection product to do so.
Important Limitations
So far, we use only common genetic variants in our scores. Rare mutations with large effects, which often run in families with severe disease histories, are not currently incorporated into these scores, and we analyze these variants separately. Future scores will integrate both common and rare variant information for comprehensive risk assessment. We have already done a lot of work here — stay tuned for our new models that integrate much more information beyond polygenic scores.
Looking Forward
Our research and methods establish a new standard for polygenic score validation in reproductive medicine. By demonstrating that our scores maintain accuracy within families and by improving cross-ancestry performance, we've addressed two of the most critical barriers to clinical implementation. We believe this work will help make genetic risk assessment a more accepted and effective option for family planning.
Our ambition is to remain at the forefront of this field, both by discovering and driving our own innovations and incorporating new methods from academia. We believe rigorous validation and transparent communication of results are essential as this field develops, and our complete research paper, including detailed methods and supplementary analyses, is available on our website25.
However, this paper is just a starting point. Our score set has already expanded beyond what we outline here (see the risk reduction calculator on our website for a better idea), and we are preparing new results for publication — including for cognitive ability. We have made a variety of exciting breakthroughs that we will discuss in the coming months, and we look forward to sharing them with you.
The Herasight Team

Note: liability R² is not to be confused with the concept of heritability, which describes the total proportion of variation in a trait attributable to genetic differences between people. Heritability represents an upper bound for the predictive ability of a polygenic score.
A related problem is that sometimes even when a biobank has genetic data from people from diverse ethnic groups, they may make it difficult to access, or they may not have all of the phenotypic information that researchers may be interested in — e.g., data about a specific disease like diabetes or schizophrenia.
Young, Alexander I., et al. "Mendelian imputation of parental genotypes improves estimates of direct genetic effects." Nature genetics 54.6 (2022): 897-905.
https://archive.md/lGf4S (Accessed 7/28/25)
https://archive.ph/lGf4S (Accessed 7/29/25)
We derive this by using the stated 38% relative risk reduction and population prevalence of 31% to calculate the implied liability-scale R² for the score, then running MCMC simulations for draws of 5 unrelated individuals or siblings, calculating the average realized RRR, and taking the ratio of the two.
https://archive.md/1Es3n (Accessed 7/28/25)
https://archive.md/eSzmO (Accessed 7/31/25)
https://archive.md/ZK9tG (Accessed 7/31/25)
https://archive.md/STJgO (Accessed 7/31/25)
https://archive.md/iDMiP (Accessed 7/28/25)
https://archive.ph/lGf4S (Accessed 7/29/25)
Lello, Louis, Timothy G. Raben, and Stephen DH Hsu. "Sibling validation of polygenic risk scores and complex trait prediction." Scientific Reports 10.1 (2020): 13190.
Widen, Erik, et al. "Polygenic health index, general health, and pleiotropy: sibling analysis and disease risk reduction." Scientific reports 12.1 (2022): 18173.
While these reports were provided for adults, not embryos, no information on Nucleus’s website indicates that a different set of predictors is used in their embryo models.
https://archive.md/VFmCf#selection-469.6-469.133 (Accessed July 7/28/25)
Olfson, Emily, et al. "Rare de novo damaging DNA variants are enriched in attention-deficit/hyperactivity disorder and implicate risk genes." Nature Communications 15.1 (2024): 5870.
Demontis, Ditte, et al. "Discovery of the first genome-wide significant risk loci for attention deficit/hyperactivity disorder." Nature genetics 51.1 (2019): 63-75.
Demontis, Ditte, et al. "Genome-wide analyses of ADHD identify 27 risk loci, refine the genetic architecture and implicate several cognitive domains." Nature genetics 55.2 (2023): 198-208.
Alemu, Robel, et al. "An Updated Polygenic Index Repository: Expanded Phenotypes, New Cohorts, and Improved Causal Inference." bioRxiv (2025): 2025-05.
We thank Shai Carmi for helpful feedback on an earlier version of our whitepaper.
An excellent post/paper. Congratulations with the exit from the stealth mode and the commercial launch!
One quibble is the threshold model as applied to late-onset diseases.
See: https://peerj.com/articles/7168/ and some of the https://www.mdpi.com/1422-0067/20/20/5013
However, if an age cut off was chosen, say diagnosed by age 70, this will work very well. Which hopefully what was done in the models.
The first paper also contains a good, and rarely stated realization, on interplay of PGS and age for late-onset diseases. Largely it is consilient with your criticism of the competitors.