
Validating the world’s most powerful genetic predictor of cognitive ability
CogPGT 1.0 is now peer-reviewed and published. Here's what the paper shows and why it matters.

Last October, we posted a preprint introducing CogPGT 1.0 alongside our comprehensive ethics paper. Our validation work covered a lot of ground: within-family prediction in two datasets on thousands of sibling pairs, off-target pleiotropy analyses, gene-environment interaction tests, portability across ancestry groups, and associations with life outcomes ranging from income to occupational status. The post generated productive debate among geneticists and methodologists on X, which helped us improve the analysis.
Today, the paper is officially published in Intelligence & Cognitive Abilities, under title: “Interpreting polygenic prediction of cognitive ability: Evidence for direct, reliable, and portable genetic effects.” This post reviews what we initially found, what we improved along the way, and what the final paper establishes.
Table of Contents
The within-family gold standard
Most polygenic scores are built using data from unrelated individuals. These scores are useful for some questions, but as we explained in our very first post, it isn’t the appropriate approach for embryo screening. People with higher polygenic scores for intelligence don’t just differ genetically from people with lower scores, but they also often grow up in more cognitively stimulating environments, with wealthier and more educated parents. When we find that a polygenic score predicts intelligence in a sample of the general population, it is unclear how much of the prediction captures the real genetic effects versus the effects of family environments that are associated with those genes.
Within sibling pairs, this problem largely disappears. Siblings typically share the same parents, the same household, the same neighborhood, and broadly similar socioeconomic circumstances. These are many of the environmental factors that tend to confound genetic studies. What differs between them is largely the random draw of which genes each inherited. This makes siblings a natural control group: by comparing them directly, we can strip away much of the environmental noise and isolate the true genetic signal. If a polygenic score predicts cognitive differences between two siblings raised in the same home, the most natural explanation is a direct genetic effect on cognition, not a proxy for familial factors. It’s also the only relevant frame for embryo screening: when parents are choosing between their own embryos, family background is by definition identical, and within-family genetic variation is everything.
Researchers typically look at the ratio of effect sizes between population and sibling analysis to quantify the reduction in predictive performance. As we have previously shown for many diseases, this ratio is not significantly different from one, but for more cultural traits like educational attainment, large effect reductions of up to 50% have been observed. In the UK Biobank, we observe an attenuation ratio of about 0.88. The vast majority of the signal therefore survives. In the ABCD cohort of 9–10 year olds, the score retains around 96% of its predictive power within families. However, due to a smaller sample size, the uncertainty around that estimate is larger.
Measuring latent cognitive ability
But what is our actual predictive performance? To answer this question, we need to establish what we are actually measuring: A 13-item cognitive test taken in 2 minutes as part of a multi-hour clinical intake process for the UK Biobank is a far cry from someone’s actual general cognitive ability. It’s a noisy snapshot influenced by how much sleep someone got, whether they found the instructions confusing, if the touch screen worked properly or many other factors. There is a reason why gold standard intelligence tests like the Wechsler take multiple hours and require assessment by a trained psychometrician.
Classical test theory, which psychologists have understood for over a century, tells us that measurement error attenuates observed associations. If you measure someone’s true ability with error, the correlation between your noisy measurement and anything else (including their genotype!) will be smaller than the true underlying correlation. The noisier the test, the more the association shrinks.
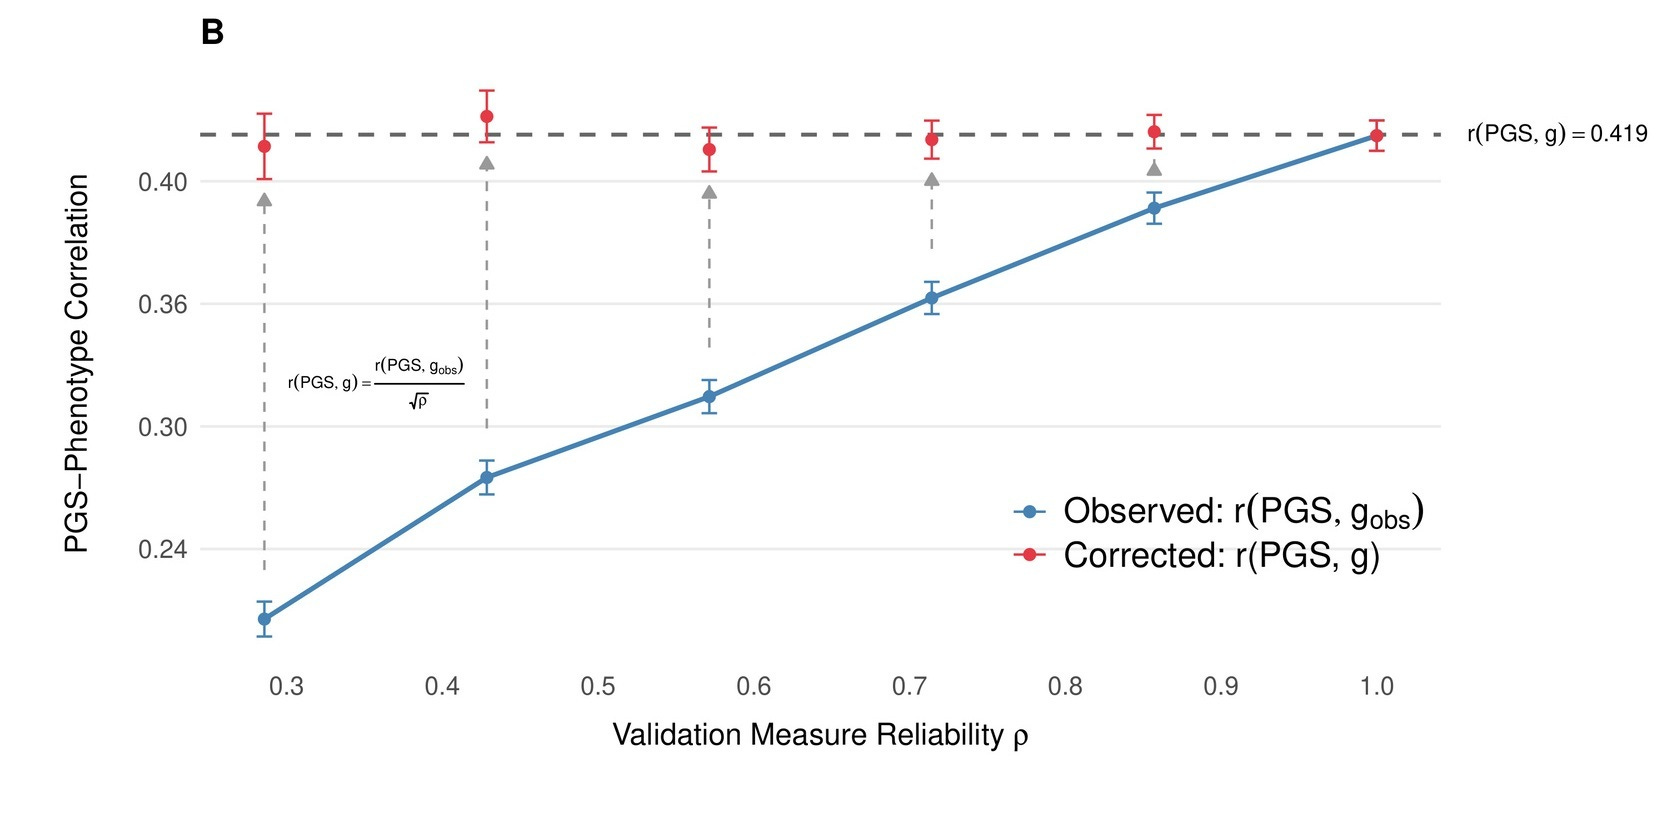
The practical consequence of this can be significant: When a study reports that a polygenic score explains a certain amount of variance in a brief biobank cognitive test, that number is not the same as the score’s relationship with actual general cognitive ability. The true relationship with the latent trait is larger — how much larger depends on how reliable the test is. In the initial preprint, we used classical test-theory corrections to recover these latent-scale estimates, drawing on reliability estimates from the literature, which some skeptics, however, considered to be based on too small a sample. Therefore, we also estimated the reliability using all UKB participants who had taken the fluid intelligence test multiple times over the years (N = 29,879). We also found an additional published reliability measurement in UKB, which relied on internal consistency (cronbach’s alpha). All methods in the end gave very similar estimates and established a reliability in the range of ~0.6-0.64 for the fluid intelligence measure in UKB. We applied similar methods in our second cohort, ABCD and meta-analyzed both cohorts, giving us an effect estimate that corresponds to ~20% of the variation in intelligence being explained by our score between siblings.
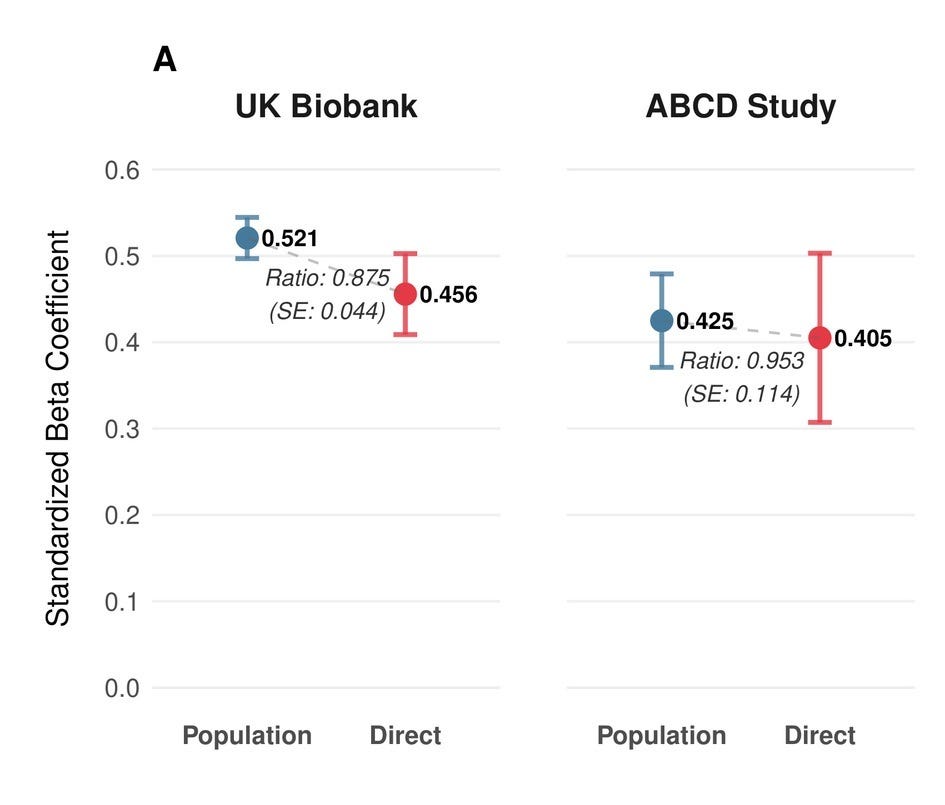
However, even after these corrections, our population-level estimates still diverged more than expected between cohorts, with β = 0.521 in UKB adults versus 0.425 in ABCD. The resolution was, as a few people on X had urged us, to go beyond classical test theory. Rather than applying a reliability correction as a post-hoc adjustment, we modeled the underlying cognitive structure directly: Instead of measuring intelligence in UKB with one test and correcting for its noisiness afterward, we used the full pattern of relationships across multiple cognitive tests to infer what they’re jointly measuring. This is a more principled approach and it turned out to matter. UKB fits well as a single factor, with the fluid intelligence test we used previously showing the highest loading (λ = 0.74). ABCD needed a hierarchical model with three first-order domains — crystallized ability, executive function/processing speed, and memory — nested under a general factor. Once we modeled each cohort’s cognitive structure correctly, the discrepancy vanished to a degree that surprised even us: within-family effects converge to δ = 0.439 (UKB) and 0.435 (ABCD), and population effects to β = 0.525 and 0.509, matching the within-family performance of our classical test theory-based approach almost perfectly.
We stress-tested these latent-scale estimates to make sure they aren’t artifacts of particular modeling decisions. First, we verified that our ABCD results hold whether we assume a one-factor, hierarchical, or bifactor structure, all three converge on essentially the same within-family estimate (δ ≈ 0.40–0.44), differing in fit quality rather than in what they imply about polygenic prediction. More consequentially, we needed to confirm that the PGS genuinely predicts general cognitive ability rather than acting through idiosyncratic pathways, like making someone specifically better at pattern recognition on a screen, say, rather than broadly smarter. We tested this by establishing metric measurement invariance across PGS strata and running MIMIC models to screen for differential item functioning: no individual cognitive indicator showed significant direct effects of the PGS, confirming that the genetic signal operates through the latent trait itself, not through item-specific factors.
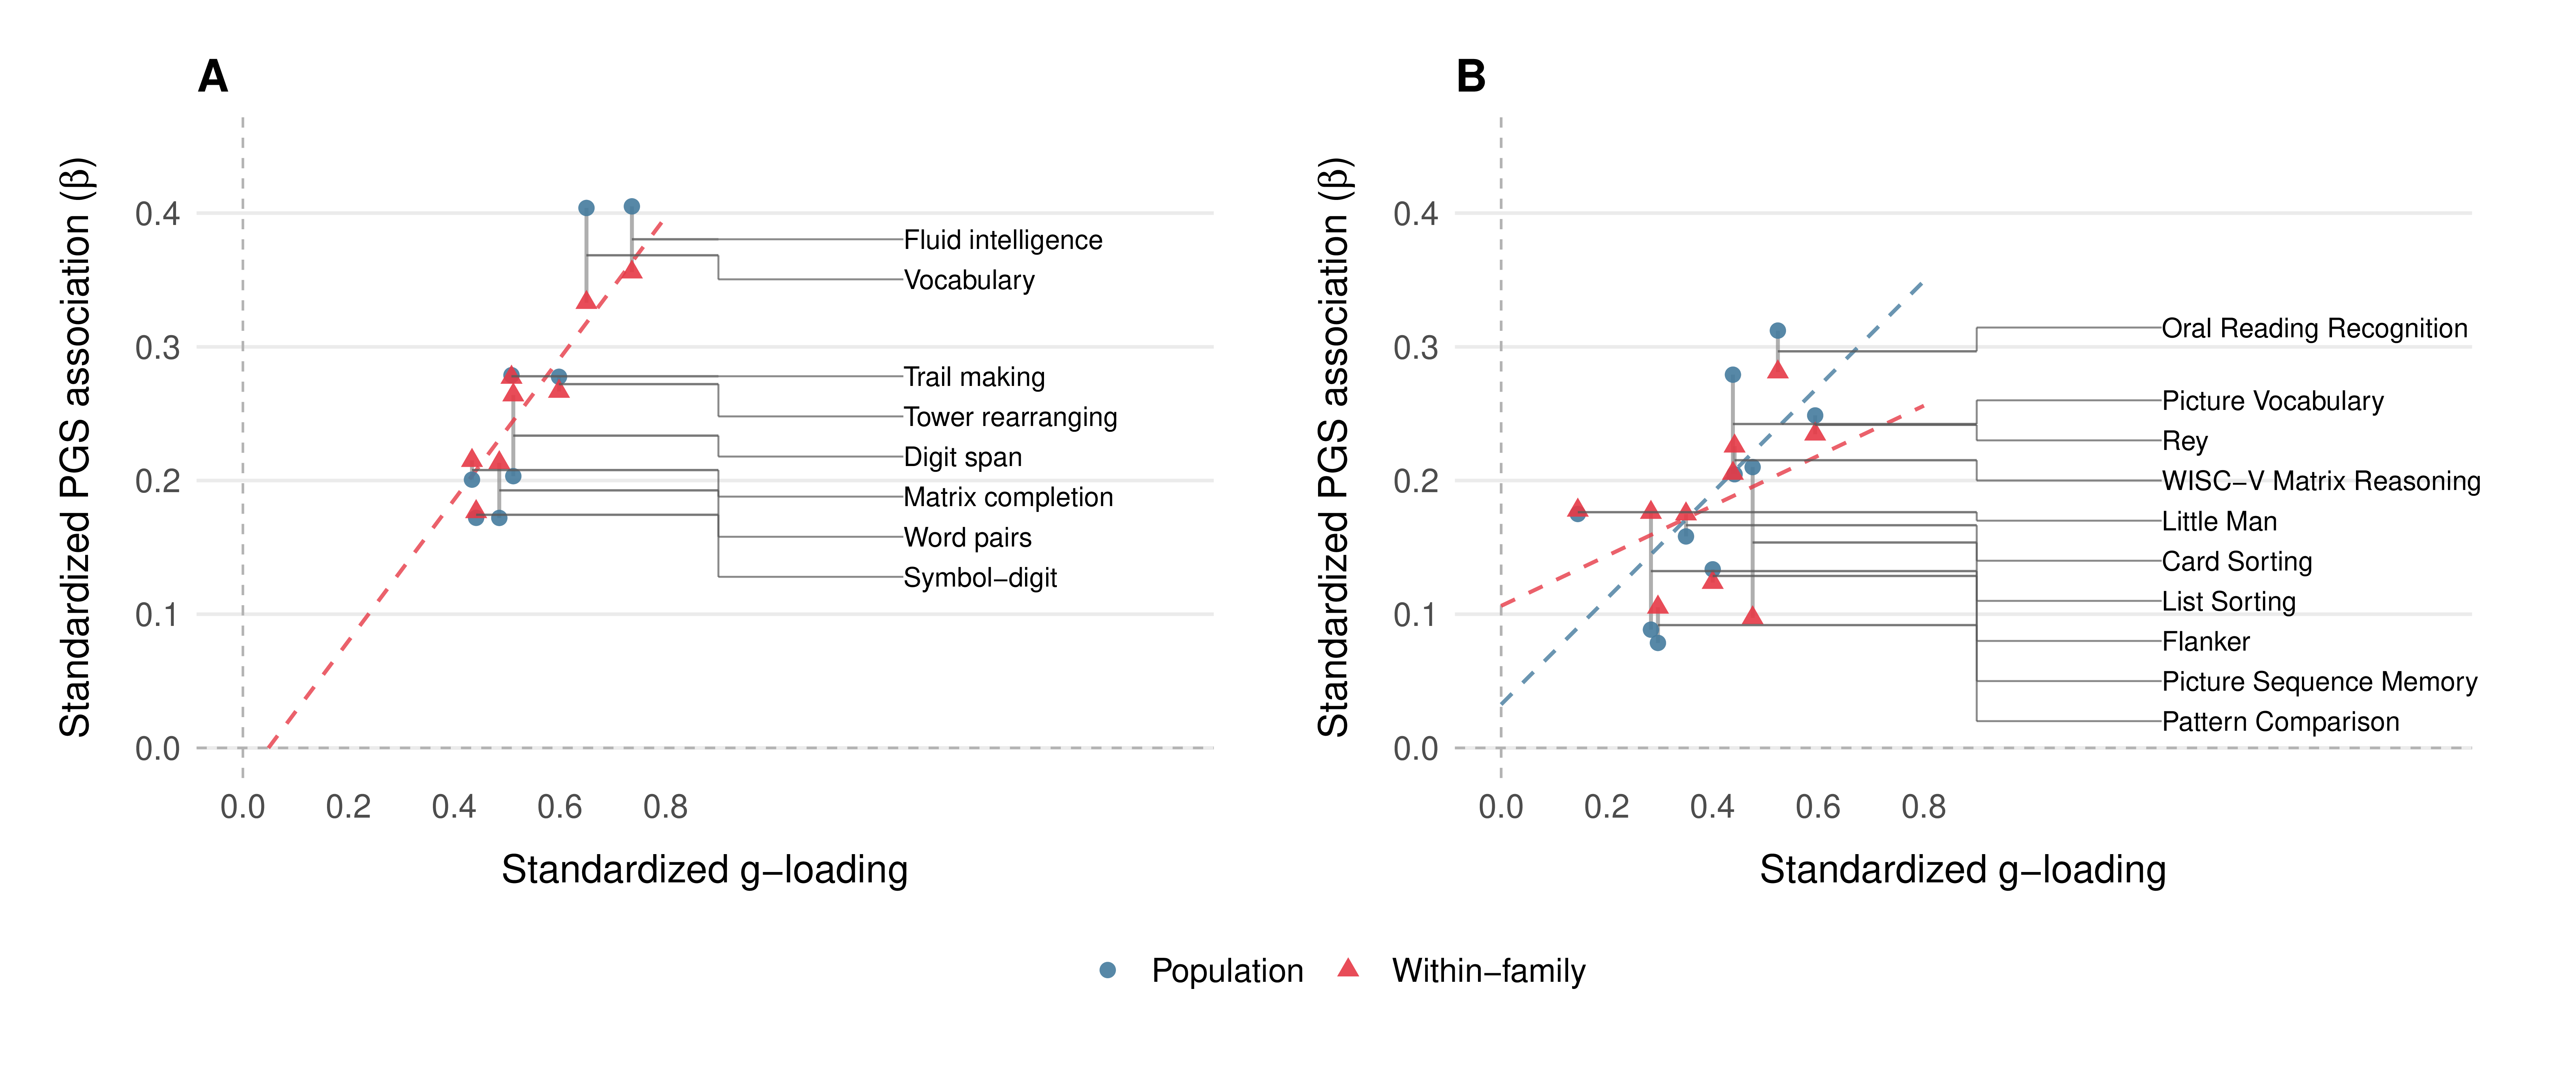
Finally, based on a reviewer’s feedback, we checked whether the score’s predictive power was concentrated where it should be. If CogPGT genuinely measures general cognitive ability rather than some narrow skill, it should predict g-loaded tests more strongly than less g-loaded tests. This is exactly what we observe. Across the eight cognitive indicators in UKB, the correlation between each test’s g-loading and its PGS association is 0.97 at the population level and 0.93 within families. The score tracks general ability with near-perfect fidelity: fluid intelligence and vocabulary (the most g-loaded tests) show the strongest PGS associations, while less g-loaded tasks like symbol-digit substitution show the weakest. In ABCD, point estimates are lower (population r = 0.66, within-family r = 0.46) but come with wide confidence, so they should not be overinterpreted. The overall pattern is clear: the score does not accidentally predict processing speed, or reading ability, or any other narrow cognitive domain. It predicts g, and the tests that are better measures of g are the ones it predicts best.
Progress on missing heritability
Twin studies have long suggested that genetic factors explain around 50–80% of the variation in cognitive ability. But when researchers analyze the genome of large samples of unrelated individuals, the common genetic variants they identify collectively explain far less, typically around 20%. This gap is sometimes called the “missing heritability” problem, and it has generated a lot of speculation: rare variants, gene-gene interactions, epigenetics, and so on.
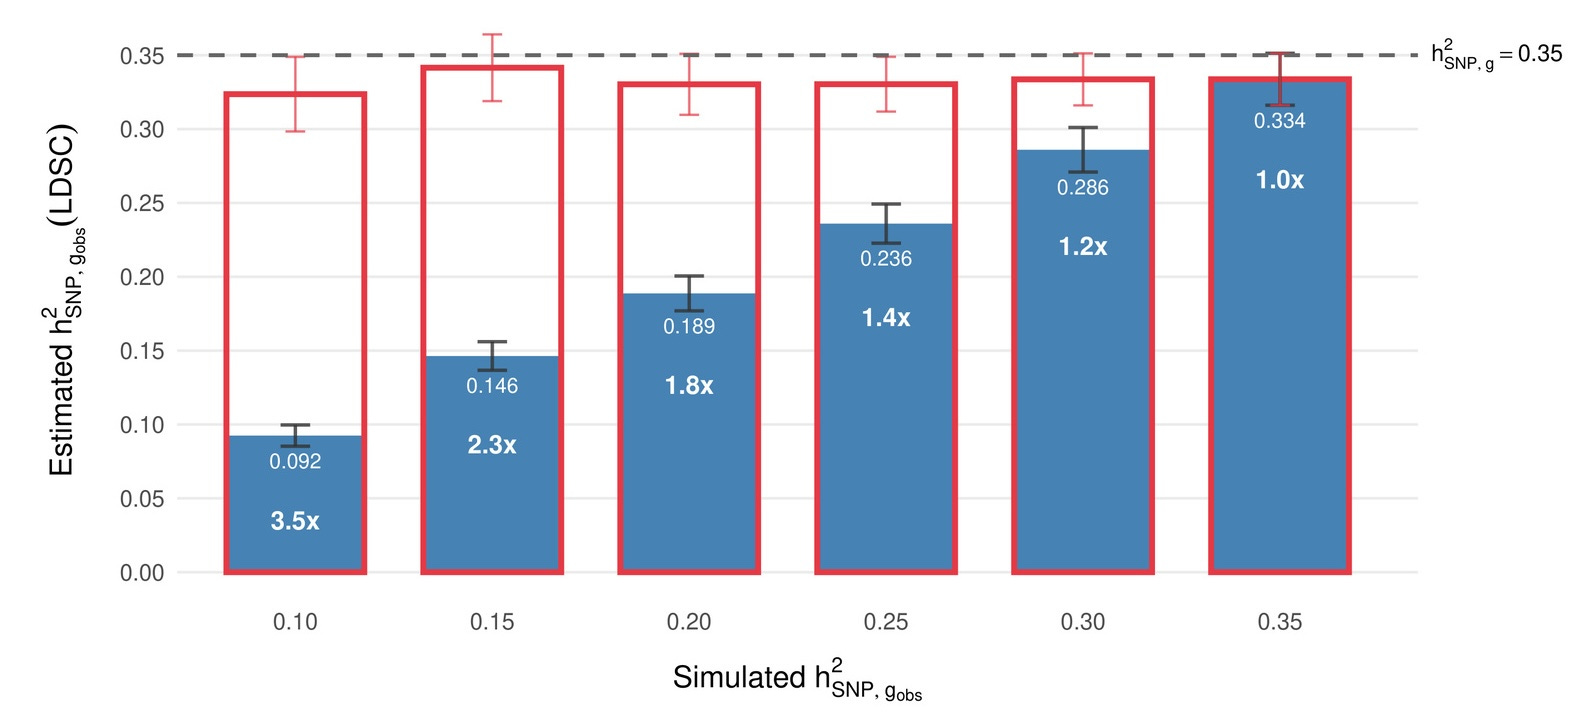
Our reliability framework suggests an underappreciated explanation for at least part of the gap. Twin studies typically involve careful, extended cognitive assessments administered on the same day, at the same age, and often by the same rater, meaning they suffer substantially less from measurement error to begin with. Furthermore, aspects of that measurement error might actually be heritable themselves. Biobank studies, on the other hand, use brief tests administered to hundreds of thousands of people. If the biobank test has a reliability of ~0.6, then the observed SNP-heritability is artificially constrained. In other words, a lot of what’s “missing” is simply obscured by noise in the phenotype measurement.
Our framework makes a concrete, testable prediction from this: a high-quality cognitive measure should show a common-variant SNP-heritability of 0.33–0.35, not the ~0.22 reported for brief biobank tests. When we shared this online, some observers were surprised. Some data to check already exists: Zabaneh et al. (2017) found LDSC SNP-h² = 0.42 for SAT/ACT composites in high-ability 12-year-olds. When you measure cognitive ability carefully, a lot of the “missing” heritability reappears.
Beyond test scores: real-world consequences within families
In a 1997 editorial in the journal Intelligence, Linda Gottfredson defined general intelligence as “a very general mental capability that, among other things, involves the ability to reason, plan, solve problems, think abstractly, comprehend complex ideas, learn quickly and learn from experience.” She noted that “it reflects a broader and deeper capability for comprehending our surroundings – ‘catching on,’ ‘making sense’ of things, or ‘figuring out’ what to do.” If a polygenic score is truly capturing this construct, its effects should not stop at the boundary of a cognitive test. It should predict how people navigate the real world. And it should do so within families, where siblings share the same parents, the same household, the same school district, and the same socioeconomic starting point.
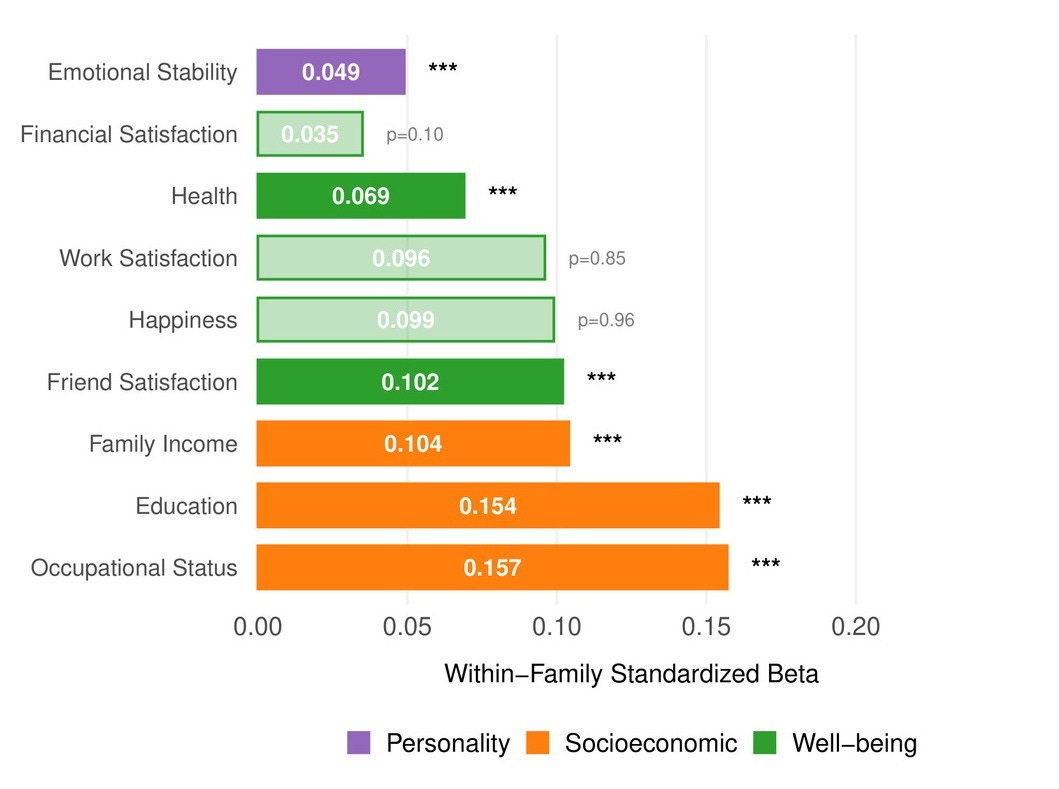
Within UK Biobank sibling pairs, the sibling with the higher CogPGT score attains significantly more education (β = 0.154 SD per SD of PGS), higher occupational status (β = 0.157), and greater household income (β = 0.104). The effects extend beyond socioeconomic outcomes. Higher-scoring siblings also report better health (β = 0.069), greater satisfaction with friendships (β = 0.102), and lower neuroticism (β = 0.049). There were no significant within-family effects on general happiness or work satisfaction, which is consistent with the broader behavioral genetics literature: cognitive ability shapes the objective circumstances of people’s lives more reliably than their subjective experience of them. On the other hand, subjective evaluations like this might be more prone to measurement error than objective measurements.
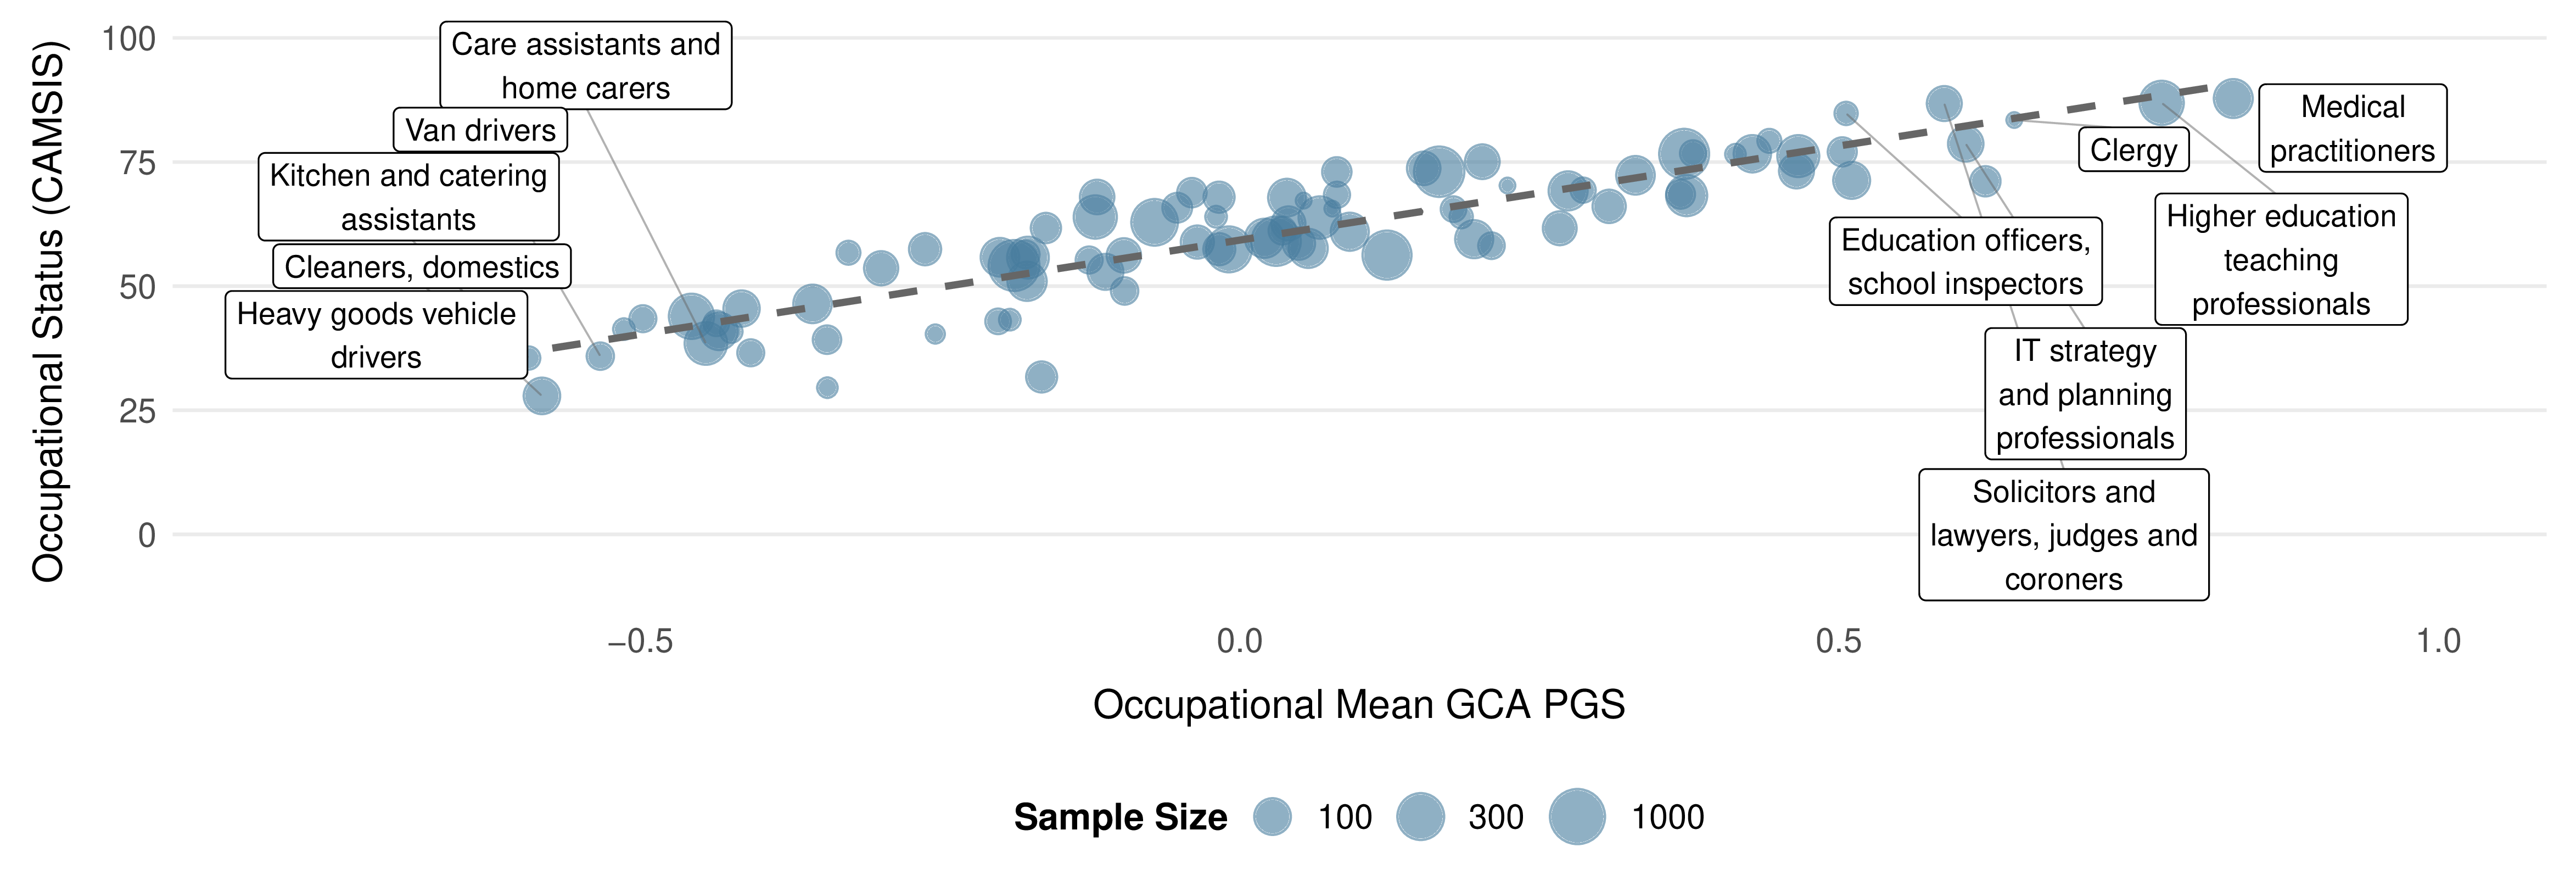
The occupational gradient becomes particularly clear when you zoom out from sibling pairs to the full UK Biobank. Averaging CogPGT scores by occupation reveals a systematic stratification that closely tracks the cognitive demands of different professions and is highly correlated with occupational status, as sociologists measure it: medical practitioners, academics, IT professionals, and lawyers cluster at the top, while manual and service occupations cluster at the bottom. None of this is new as a finding about intelligence and work. That relationship has been documented extensively, in part by people on our team. What is new is that a polygenic score constructed from DNA alone recovers the occupational hierarchy with this degree of resolution.
Health, well-being, and pleiotropy
A common worry about selecting for cognitive ability is antagonistic pleiotropy: the idea that genetic variants linked to higher intelligence might increase risk for certain conditions. Our data cut the other way.
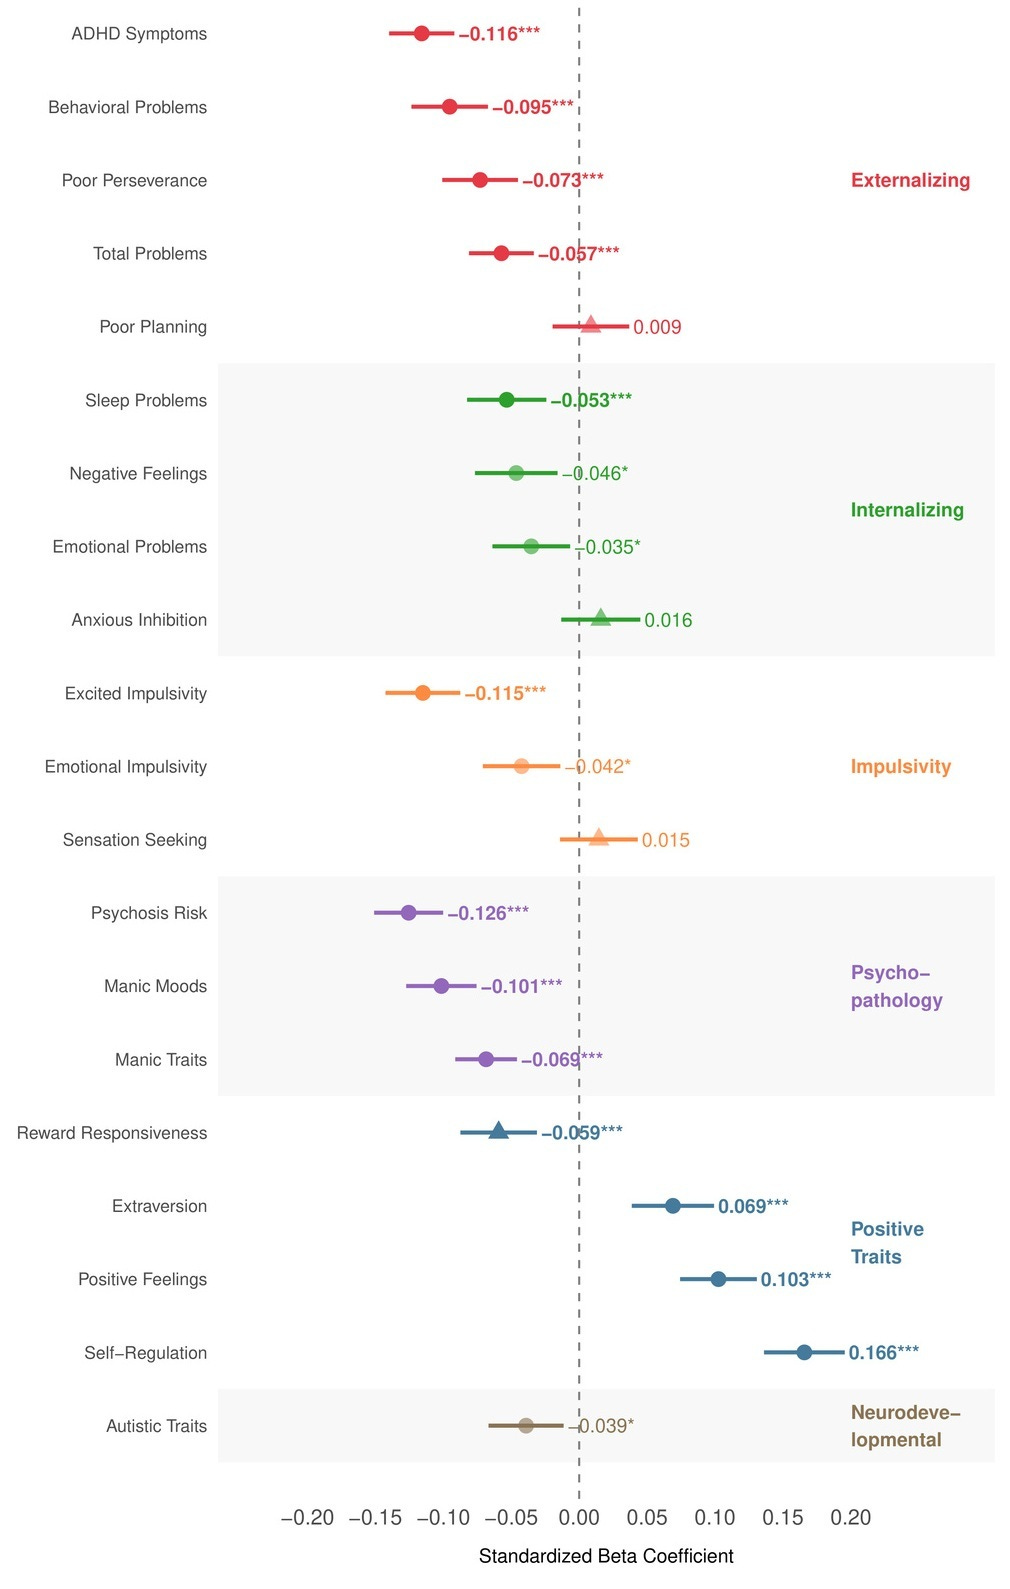
We ran a pleiotropy scan across 20 psychological and neurodevelopmental outcomes in ABCD. Higher CogPGT scores were associated with fewer psychotic-like symptoms, lower ADHD symptoms, reduced externalizing behaviors, fewer sleep problems, and higher positive affect. We found no significant positive association with autistic traits, the direction is actually weakly negative, which contradicts concerns derived from genetic correlation estimates. Due to small sample size, these are between-family associations and should be treated as directional rather than causal for now.
The story extends to physical health. Within up to 17,661 UKB sibling sets, higher CogPGT scores show direct protective associations against cardiometabolic conditions, including type 2 diabetes, and coronary artery disease and no positive association with any disease outcome. In contrast to the mental health results in ABCD, these estimates are actually all validated within-family and therefore overall likely causal.
Portability across ancestries
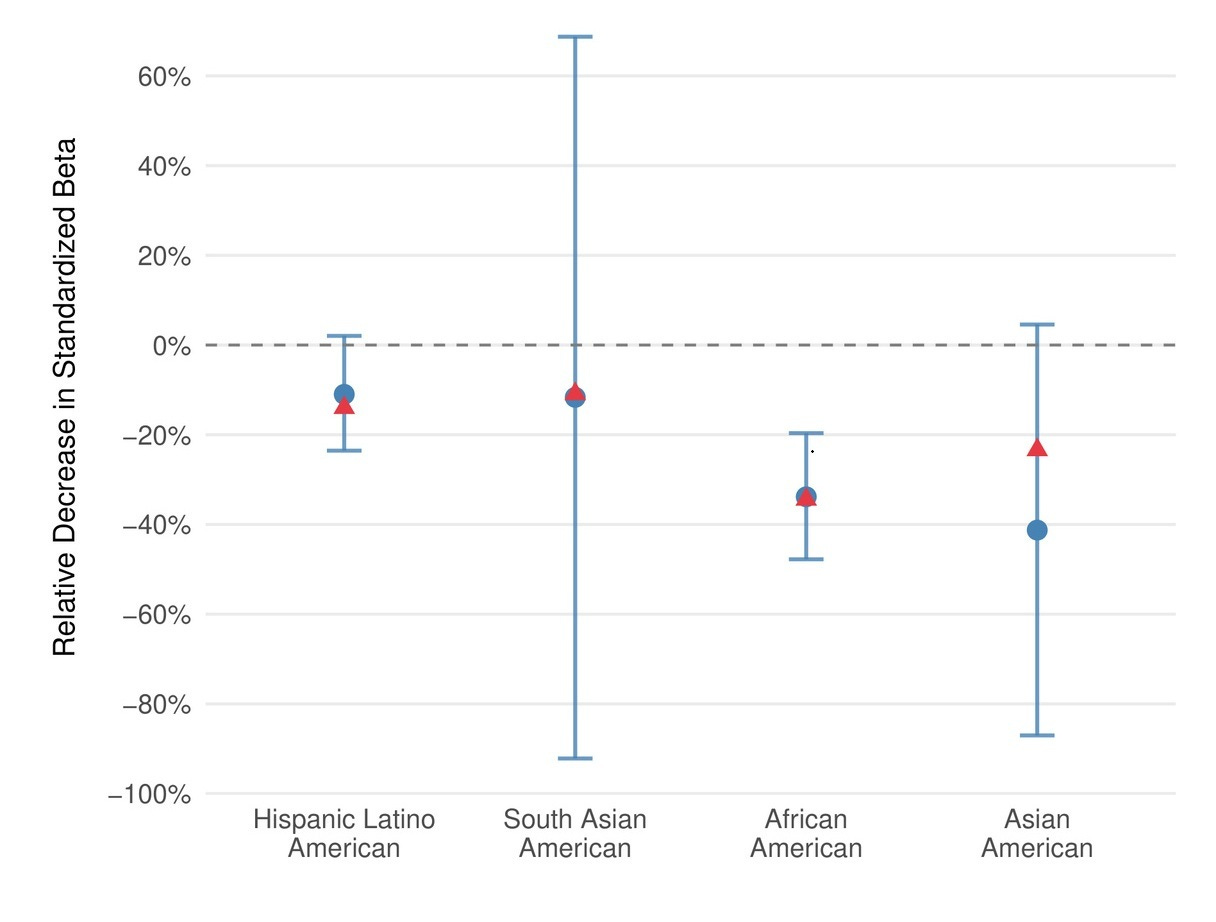
Polygenic prediction accuracy decreases with genetic distance from the training data, which remains predominantly European. CogPGT follows this expected pattern. In ABCD, stratified by ancestry, it retains roughly 89% of its effect size in Hispanic/Latino Americans, 88% in South Asian Americans, 64% in African Americans, and 59% in East Asian Americans.
These drops track closely with theoretical predictions from genetic distance, and they are consistent with what we observe across other complex traits. Closing this gap is a priority — it’s one of the reasons we developed ImputePGTA V2 to jointly model all embryos in a cycle and correct for phasing errors that disproportionately affect non-European families. But this is a quantifiable problem, not an intractable one.
No evidence for gene-environment interactions
Gene-environment interactions (GxE) for cognitive ability, where genetic influence on cognition supposedly depends on socioeconomic status or other cultural factors are frequently proposed as a major factor in individual differences. However, empirical evidence on this topic has always been mixed.
The early and highly influential U.S. studies claiming to find this moderation relied on remarkably small samples. Turkheimer et al. (2003) inferred Scarr-Rowe moderation from just 319 twin pairs (114 MZ, 205 DZ) measured at age 7, yet detecting small moderation effects of this kind typically requires thousands of twin pairs. Later meta-analytic support, such as Tucker-Drob & Bates (2016) only found significant effects in post-hoc subgroup comparisons (U.S. vs. non-U.S. heterogeneity) that have not held up in subsequent, better-powered replications using both twin and administrative data from population-scale samples.
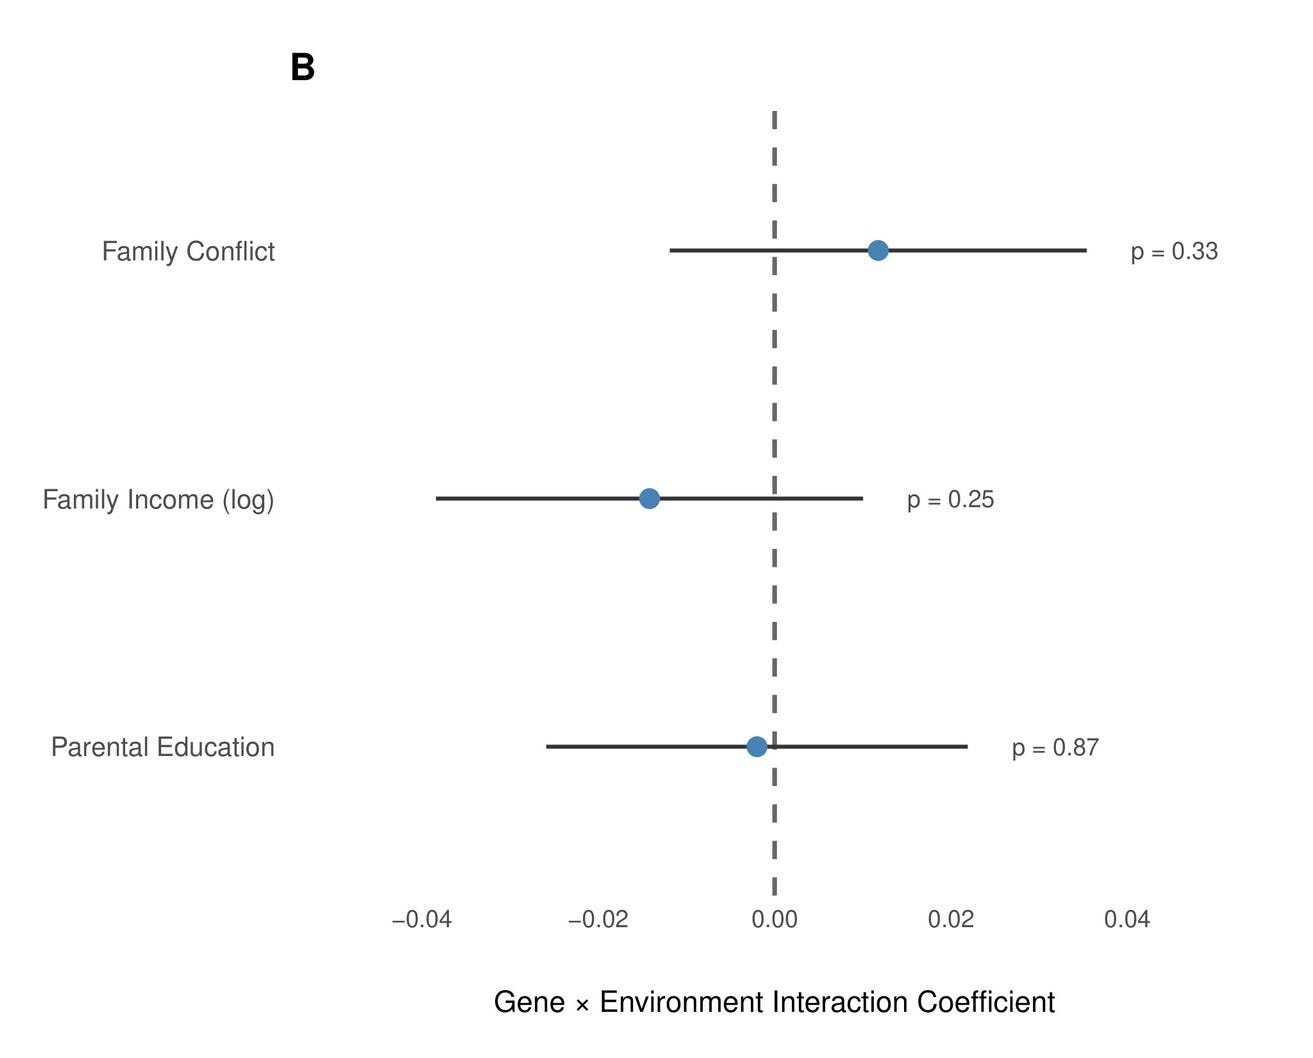
Our findings align in that sense with the literature: We examined interactions between the PGS and three key environmental moderators in the European-American subset of ABCD (N ≈ 5,000–5,700): Parental education was measured as the average years of schooling across both parents (N = 5,032, p = 0.87). Family income was the natural log of combined household income (N = 5,395, p = 0.25). Family conflict was assessed using the parent-reported Family Environment Scale conflict subscale, which captures overt disagreement and hostility within the household (N = 5,670, p = 0.33). None approached significance.
Replicating our results
Based on feedback we received during peer review and because we were curious to what extent our findings reflect human biology rather than idiosyncrasies of a particular pipeline, we repeated the entire validation process using summary statistics from the largest intelligence GWAS published in the literature (Savage et al. 2018) and processed them with the LDpred2 algorithm to construct a comparison polygenic score. And while every qualitative conclusion held, the quantitative differences illustrate why an off-the-shelf polygenic score is not necessarily adequate for embryo screening.
The most revealing comparison is cross-cohort transfer. Moving from UKB adults to ABCD children, our score’s within-family performance is virtually identical, especially in the latent model. The benchmark falls from an already lower ~12% variance explained within-family to just 6% within ABCD, compared to the ~20% of variance our predictor explains. The within-family attenuation ratio diverges in a related way: our score shows almost no inflation from family-level confounding in ABCD (δ/β = 0.959), while the benchmark attenuates meaningfully (δ/β = 0.776), suggesting it captures substantially more indirect genetic effects and population structure that disappear when you look within families.
The benchmark analysis therefore serves two purposes. It confirms that our scientific conclusions about cognitive genetic architecture are robust to predictor choice. But it also makes concrete why the engineering work that separates these two scores matters: cross-cohort stability, within-family predictive power, and thorough screening for adverse pleiotropy are what distinguish a merely academic research tool from something one can responsibly use in a clinical setting.
What this means for parents
The within-family results show that CogPGT captures real, direct genetic effects on cognitive ability. Our findings on reliability imply that a large share of the apparent attenuation in this literature as a measurement problem rather than a genetics problem. The health associations are broadly positive. The portability gaps are real but predictable and addressable.

What does this translate to in practice? In the IVF context, embryos from the same two parents are genetic siblings, so within-family validation is the operative benchmark. The expected gain from selecting the highest-scoring embryo depends on how many are available and on ancestry. For European-ancestry parents choosing among 5 embryos, the expected IQ spread between the highest- and lowest-scoring embryos is roughly 10 points, rising to about 13 with 10 embryos and approaching 18 with 20. For East Asian ancestry, the corresponding values are approximately 8, 10, and 14 points. For African ancestry, where the current score retains about two-thirds of its European-ancestry accuracy, the expected spreads are roughly 6, 8, and 10 points. These are expected values across many selections, not guarantees for any individual case, and they assume the embryos are otherwise equivalent on criteria the parents care about.
A polygenic score is not destiny. Prediction is probabilistic, and individuals vary widely around the mean. But in a within-family context, these are significant differences, and the validation work behind them is now peer-reviewed.
CogPGT 1.0 is published and we hope you are looking forward to version 2.0, on which we are already making good progress.
If you are interested in learning more, please take a look at our publication. Subscribe to our newsletter for more updates.