Setting a New Standard in Type 1 Diabetes Prediction
How our innovative approach to T1D prediction achieves best-in-class performance

Introduction
The Herasight team is proud to announce that we have developed a new state-of-the-art Type 1 Diabetes (T1D) predictor, which is now available for IVF couples who want to lower their future child’s inherited risk of T1D. Along with this new offering, we are releasing our whitepaper, which explains the science behind our T1D predictor. In the paper, we compare three leading methods for predicting the genetic risk of Type 1 Diabetes, and describe our new approach which we call HLA-ARC. Our new T1D polygenic predictor achieves the highest predictive performance reported to date, and provides especially large improvements in performance for people of non-European ancestries. Using our new predictor, prospective parents can effectively reduce their risk of having a child with Type 1 Diabetes through polygenic embryo screening.
Table of Contents
The Impact of T1D
T1D greatly impacts quality of life, requiring continuous management through insulin therapy, dietary vigilance, and frequent blood sugar monitoring. The prevalence of T1D is approximately 0.55%1, but estimates vary.
Beyond the daily demands of insulin therapy, T1D carries the risk of acute complications that can quickly become medical emergencies. Two of the more dangerous complications are severe hypoglycemia and diabetic ketoacidosis. Severe hypoglycemia is when a person’s blood glucose (blood sugar) falls dangerously low, sometimes leading to confusion, seizures, or coma and often requires help from another person or emergency medical care. Diabetic ketoacidosis arises from absolute insulin deficiency, which drives ketone production. This leads to acid buildup in the blood and severe dehydration. Without prompt insulin and fluids, it can be fatal. Type 1 diabetics have to closely monitor their blood glucose all their life to avoid these unwanted medical crises.
T1D is also associated with many long-term complications. Persistently high blood sugar found in diabetics can lead to retinopathy, which may progress to blindness. Blood glucose can also damage nerves and blood vessels in the limbs, increasing the risk of ulcers that can get infected and may ultimately result in amputation of the limb. Chronic hyperglycemia damages the kidneys, vascular system, and nervous system, causing an elevated risk of kidney failure, heart disease, and loss of nerve function2. These and other health complications cause type 1 diabetics to live about 7 years less than someone without the condition3.
Type 1 diabetes also has major psychological costs. The condition places a lifelong burden on those affected, demanding constant blood sugar monitoring, insulin therapy, and lifestyle management. Treating and caring for Type 1 Diabetes is also very costly. In a comprehensive analysis of the economic costs of diabetes in the United States, Parker and colleagues (2024) found that diabetes now accounts for one in every four dollars spent on US health care4. People living with the disease incur an average annual medical expenditure of $19,736, which is 2.6 times higher than expected without diabetes. Around $12,000 of this amount was directly due to diabetes.
The economic consequences of T1D are not limited to health care spending. Childhood onset of the disease has been shown to affect long-term labor market outcomes as well. A large Swedish register study that followed children diagnosed with T1D into adulthood found that they were less likely to be employed and earned less on average than their peers without diabetes5.
By making this predictor available, we give families using IVF an effective way of meaningfully reducing the risk of T1D in their children.
Understanding T1D
Many people are more familiar with Type 2 Diabetes (T2D) than Type 1 Diabetes. T2D is a related condition in which the body has difficulty producing or using insulin effectively. Both types lead to chronic high blood sugar caused by problems with how the body handles insulin, but they differ in important ways. Unlike T2D, T1D is an autoimmune disorder in which the body attacks and destroys the pancreatic cells that produce insulin. Since insulin regulates blood sugar, this leads to dangerously high glucose levels that must be controlled with lifelong insulin therapy.
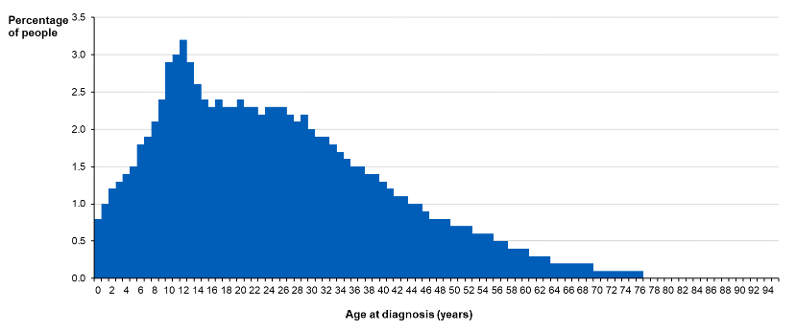
T1D often arises much earlier in life, often during childhood, and is far less affected by modifiable lifestyle factors like diet and exercise.
Genes play an important role in the development of T1D. One study found that although the general population’s lifetime risk was only around 0.4%, it was substantially elevated if a person has family members with the condition6. If a person was a dizygotic (fraternal) twin with T1D, the risk is about 6%, and if a person was a monozygotic twin with it, the risk was in the range of 25 to 50%. A person’s risk of developing T1D when a parent has it drastically increases, but the level of risk depends on which parent has the condition. If their mother has it, the risk is around 5%, but if their father has it, the risk is around 7 to 8%7.
While risk can be reduced, there are not currently any cures or effective preventative strategies for T1D. Since T1D usually arises early in life and cannot be prevented or cured, our T1D predictor gives families a way to meaningfully lower their inherited risk through embryo screening.
The Importance of the HLA region
Much of the heritable risk of T1D is affected by genes in the human leukocyte antigen (HLA) region of the genome. This region, located on chromosome 6, contains hundreds of genes, many of which play a critical role in immune function. The importance of the HLA region is unsurprising given that T1D is an autoimmune disease.
In some cases, the impact of genes in the HLA region is very strong, particularly when a person has inherited certain groups of genes or “haplotypes.” Some haplotypes are especially impactful when they are combined together. For example, people carrying both the DR4-DQ8 and DR3-DQ2 haplotypes have odds of developing T1D about 15 times higher89.
Unfortunately, conventional genome-wide scoring methods often fail to properly account for the crucial influence of the HLA region on T1D risk. This has been especially concerning when predicting T1D in diverse populations. This is because HLA haplotype frequencies and the patterns of which genes are inherited together, also known as “linkage disequilibrium”, differ substantially between ancestry groups. Since there is substantially more data available on people of European ancestry than other ancestry groups, this leads to a bias in predictive performance in which Europeans tends to be much higher.
Introducing HLA-ARC
The most sophisticated genetic prediction methods specifically include genetic markers from the HLA region, which is crucial in Type 1 Diabetes (T1D). In our analysis, we compared three methods: PRSedm, TA-PS, and T1D-MAPS.
PRSedm analyzes a limited set of known important genetic variants both within and outside the HLA region. TA-PS expands this analysis to include many more genetic markers outside the HLA region. T1D-MAPS further improves accuracy by examining entire genetic patterns (haplotypes) within the HLA region instead of individual variants.
We found T1D-MAPS to be the most accurate among these methods. To further enhance accuracy, we integrated T1D-MAPS’ sophisticated approach to the HLA region with an advanced statistical technique (SBayesRC10), creating a new method called HLA-ARC.
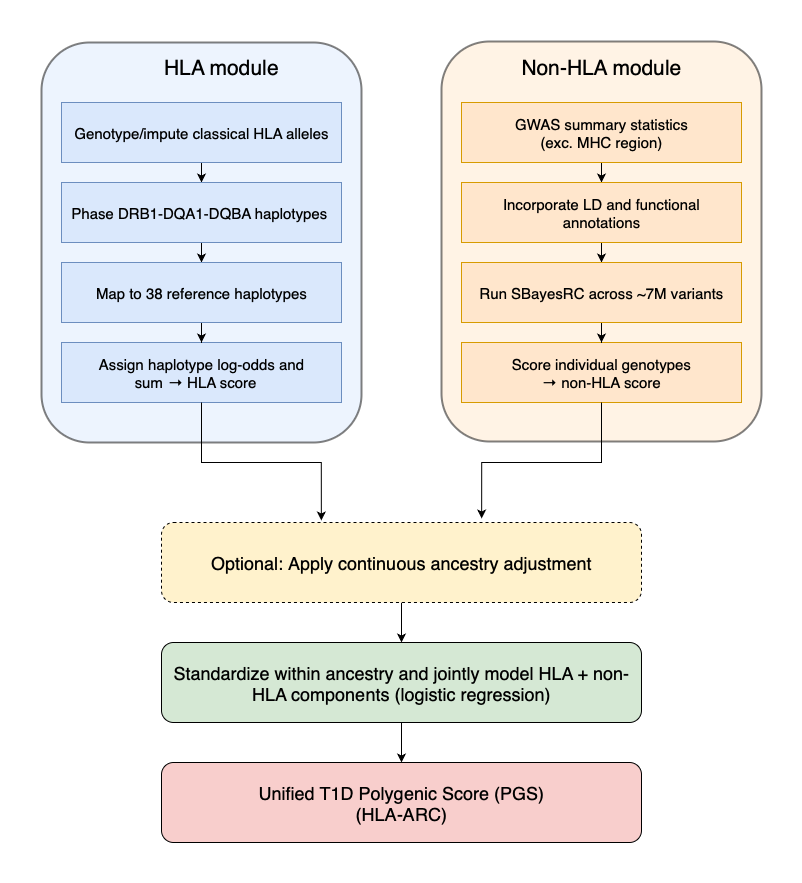
SBayesRC is a Bayesian method that uses 7 million genetic markers in combination with information about linkage disequilibrium and functional annotations. As explained earlier, linkage disequilibrium is when certain genetic variants are inherited together at a rate higher than chance. Often this can occur simply because genes are near each other on the chromosome. Functional annotations are information about what genetic variants do and where the genetic variants play a role. An annotation may tell us that a variant changes a protein in the kidney, or that it stops a protein from being made in the liver. Information like this helps SBayesRC better determine which variants are important and how important they are for a given condition.
The HLA-ARC method therefore assesses millions of genetic markers, leveraging detailed information about how variants are inherited and their biological roles, to pinpoint those most strongly associated with T1D.
To ensure accuracy across diverse populations, both T1D-MAPS and HLA-ARC include continuous ancestry adjustments. Rather than categorizing individuals into broad ancestry groups, this approach considers each person’s unique genetic ancestry profile.
Validating our Model
Using data from the All of Us Research Program (including individuals with and without T1D), we compared these methods. As shown in the accompanying plot, the HLA-ARC method with continuous ancestry adjustments achieved the best predictive performance across all ancestry groups.

The above graph shows the difference in performance with two measures: liability R² and AUROC. The R² metric is a measure of how much of the variance in susceptibility to T1D that can be explained by the model. An R² value of 0 means none of the variance can be explained and the model is useless. An R² value of 1 means that all the variance can be explained and the predictor can perfectly determine if someone has T1D. As you can see from panel A of the graph above, the HLA-ARC with continuous ancestry adjustment (HLA-ARC-cont) achieves the highest performance across all ancestries. The R² values are in the range of .30 to .38 (meaning 30 to 38% of the variance is explained).
The AUROC is more intuitive to understand. AUROC, or more formally “Area Under the Receiver Operating Characteristic curve” tells you how well the model can identify an individual with and without the condition. An AUROC of 1 means perfect ability to identify and 0.5 indicating no better than chance. The HLA-ARC-cont model achieves AUROC values in the range of around .87 to .91, with the highest value being for people of European ancestry. This means that if the model is given two people of European descent, one with the condition and one without, it will assign the higher risk score to the affected person about 91% of the time.
As you can see from the figure above, the performance metrics improved more substantially for people of non-European descent. Compared to PRSedm and TA-PS, HLA-ARC’s performance is much closer to being equal between Europeans and non-Europeans. This demonstrates that the use of haplotyping, functional annotations, and precise modeling linkage disequilibrium can help reduce disparities in genomic research. We aim to continue improving performance in diverse populations and hope other researchers will also contribute to this effort to close these gaps in understanding and effectiveness in genetic research.
Comparing against flawed industry benchmarks
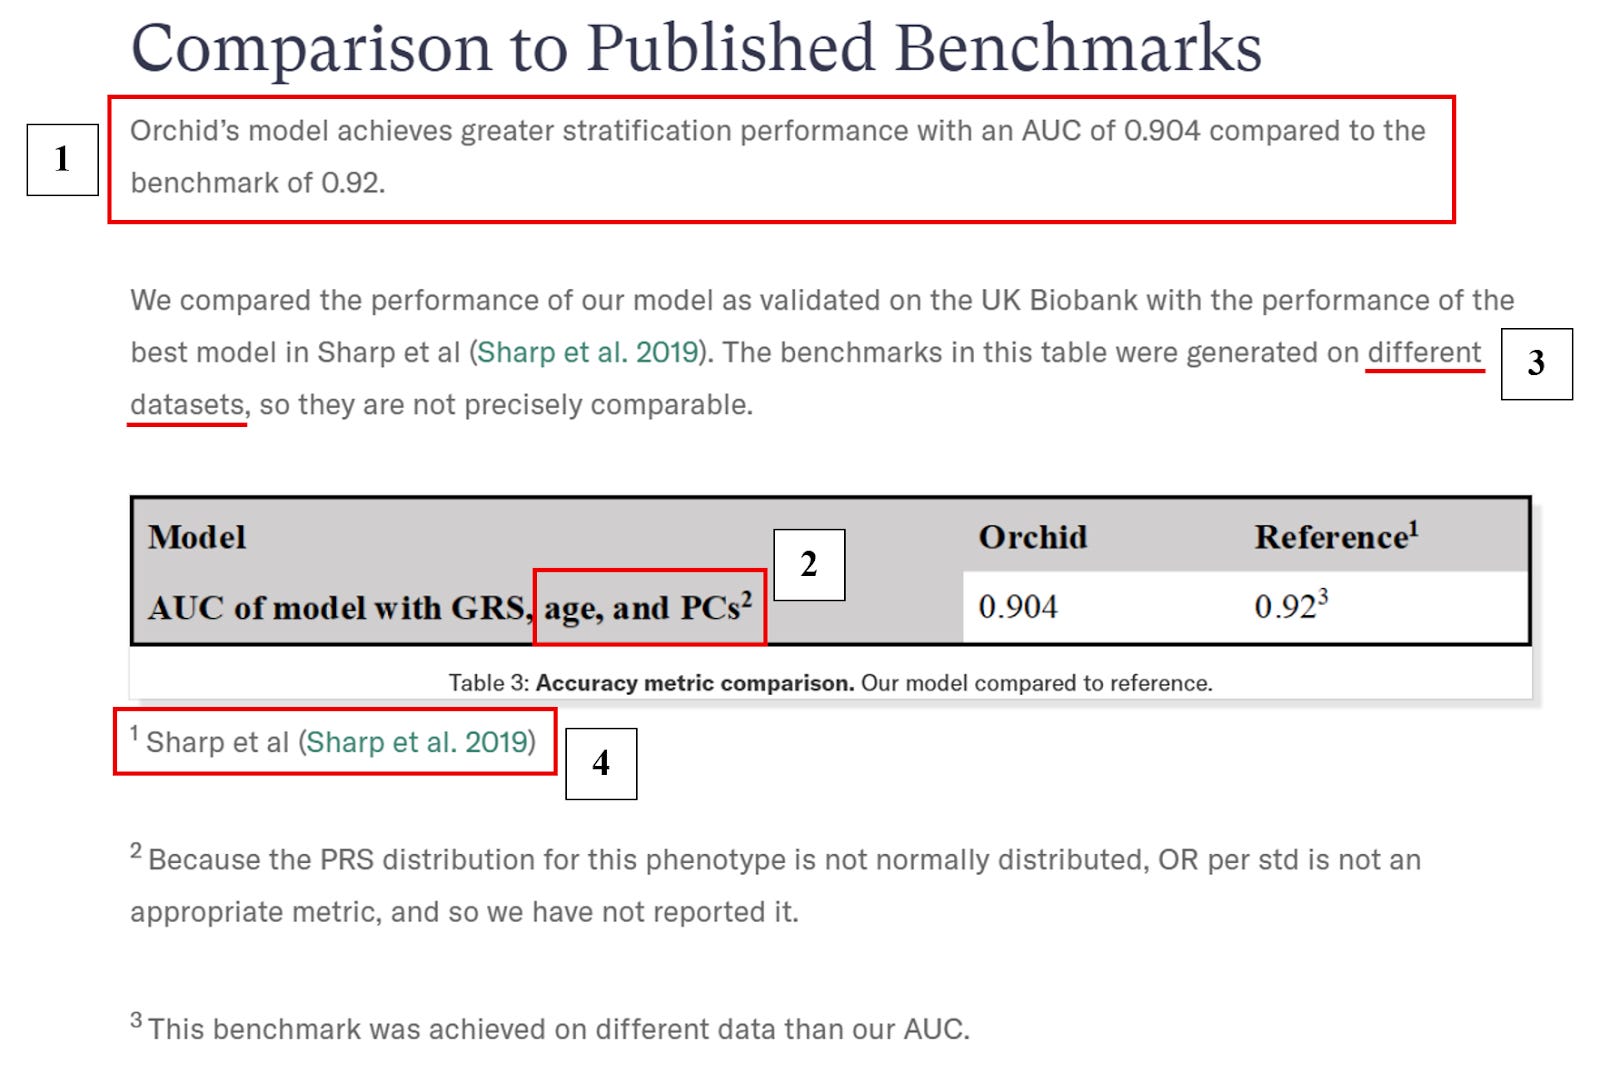
Our new HLA-ARC predictor surpasses not only academic benchmarks, but far exceeds those published by PGT-P providers Genomic Prediction and Orchid. Genomic Prediction’s approach to polygenic scoring as described in Widen et al. (2022)11 and Raben (2025)12 produces an AUC of only ~0.65 in the same All of Us data, reflecting their neglect of HLA-specific genetic variation. Orchid, on the other hand, reports an AUC of 0.904, falsely claiming to surpass an established benchmark set by Sharp et al. (2019)13 (a lower AUC corresponds to decreased discrimination of cases from controls).
Importantly, this predictor’s performance is artificially inflated due to the inclusion of age and genetic ancestry as additional covariates (so the performance does not measure the gain in prediction that comes from including genetic information, relevant for PGT-P), an issue we previously discussed in the context of Orchid’s Alzheimer’s polygenic score — see our inaugural “Building Better Scores for Embryo Screening” post for more details. Moreover, it is unclear whether properly surpassing their self-set benchmark was ever feasible given that Orchid developed their T1D predictor using an identical GWAS and a near-identical construction method as their Sharp et al. comparator (indeed, the only difference may be that Orchid’s predictor incorporates effects from three fewer SNPs than does Sharp et al.’s). We summarize these and other errors in Orchid’s T1D validation below.14
The Expected Gains from Embryo Screening
In embryo screening, our T1D predictor (HLA-ARC) enables large risk reductions. Choosing the lowest-risk embryo from two lowers relative risk by about 40–50% in European families, 35–45% in admixed American families, and 30–40% in African families. With five embryos, risk falls by roughly 70–80% in Europeans, 60–70% in admixed Americans, and 55–65% in Africans. With ten embryos, reductions reach about 80–90% in Europeans, 70–80% in admixed Americans, and 65–75% in Africans.
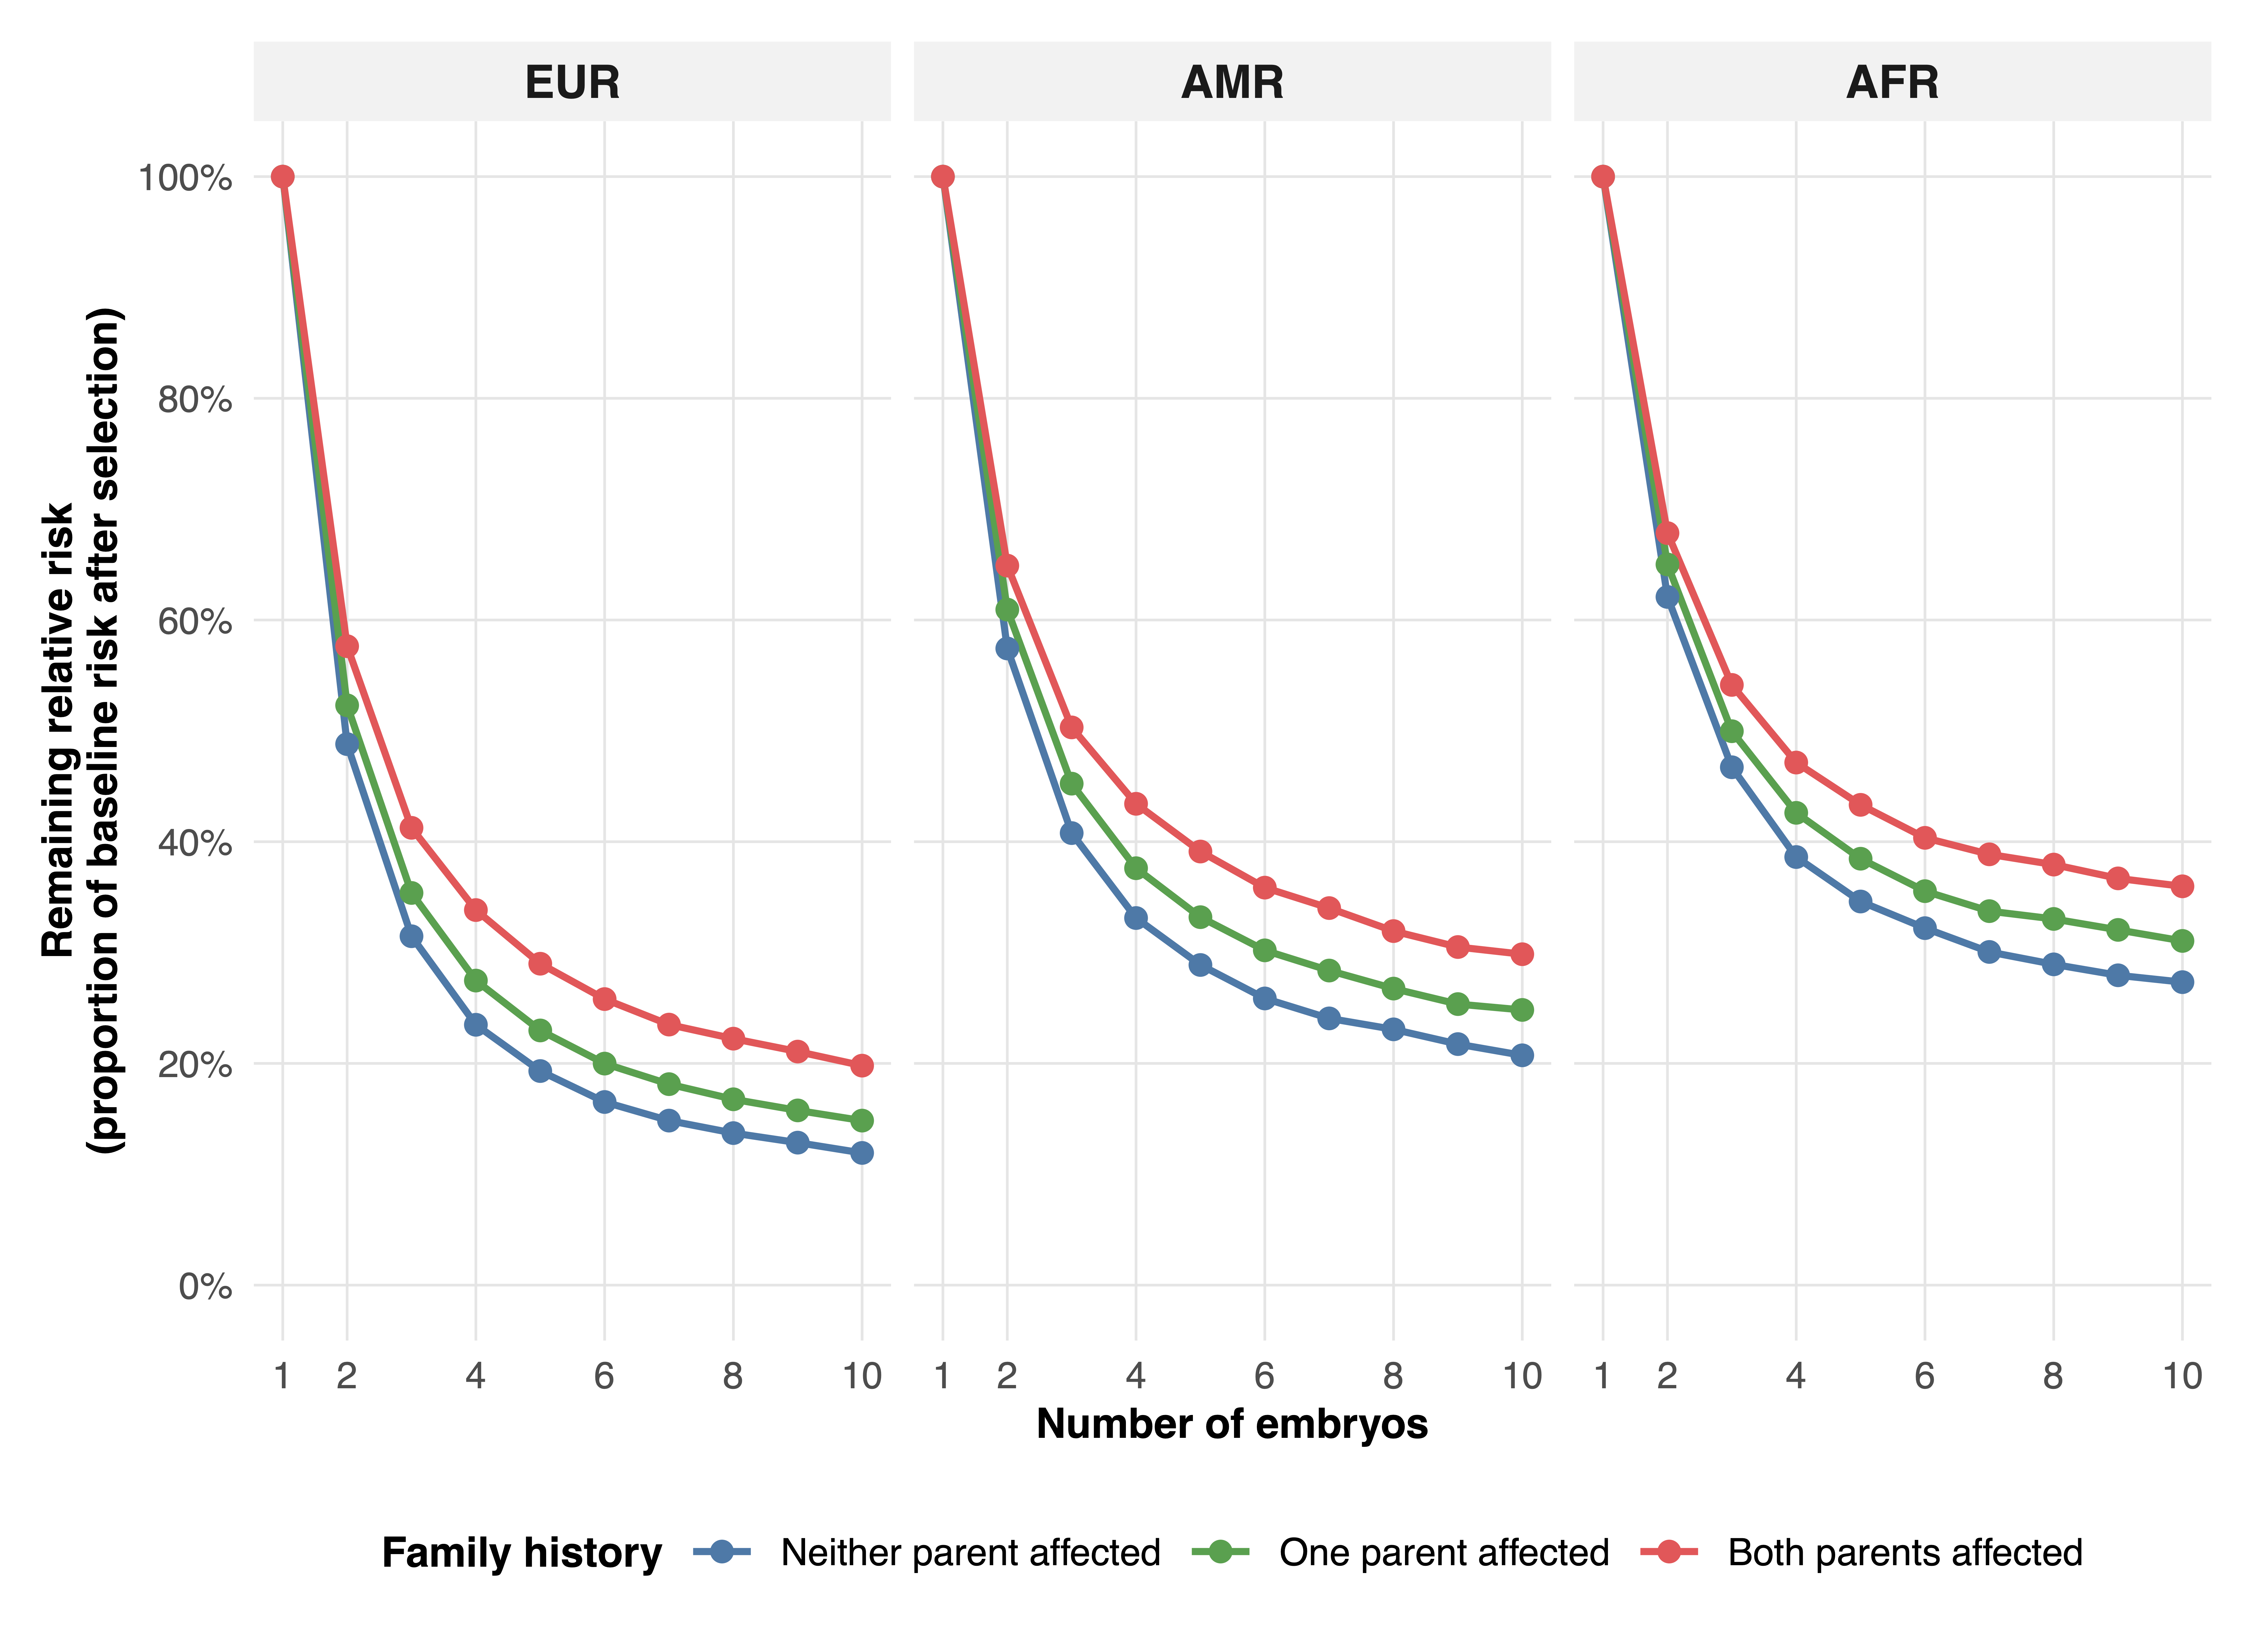
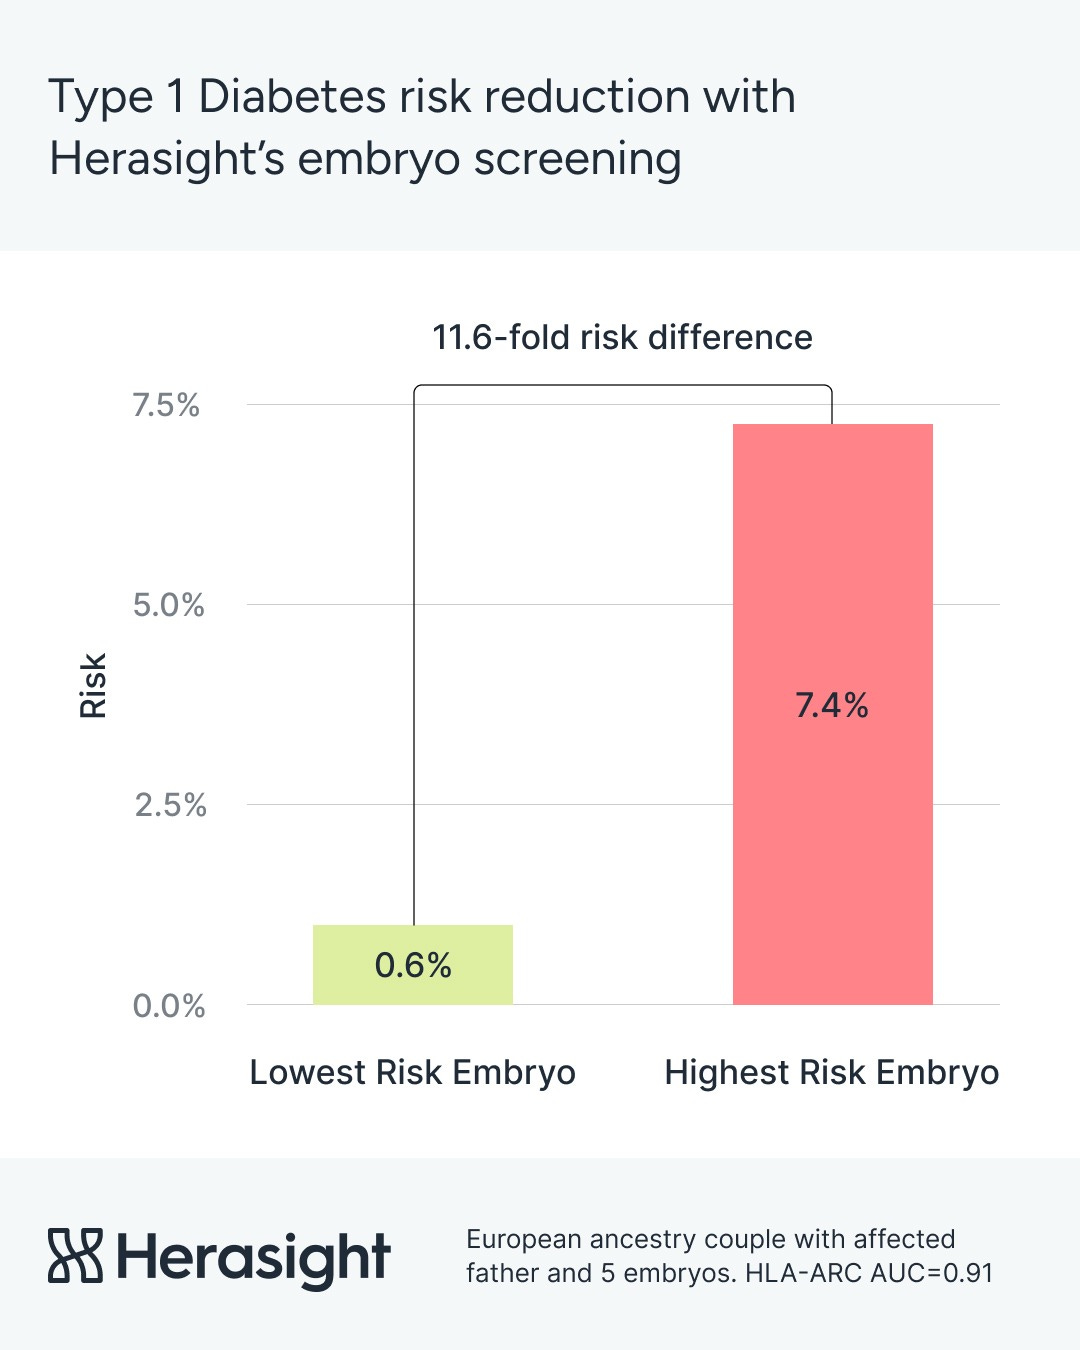
For European couples where one parent has T1D, using our predictor during embryo selection brings expected risk close to the population baseline. The risk falls from 7.4% to around 0.6% — an 11.6-fold decrease.
Conclusion
Our performance comparison demonstrates that Herasight’s HLA-ARC is the best performing predictor available for T1D. By offering our predictor for genetic screening during IVF, we provide parents with a way of meaningfully reducing the risk that their children will develop T1D. We are proud to have developed a way to help parents substantially reduce this risk.
If you are interested in learning more about our methods, please have a look at our new whitepaper and subscribe to our newsletter for more updates.

Bullard KM, Cowie CC, Lessem SE, et al. Prevalence of Diagnosed Diabetes in Adults by Diabetes Type - United States, 2016. MMWR Morb Mortal Wkly Rep. 2018;67(12):359-361. Published 2018 Mar 30. doi:10.15585/mmwr.mm6712a2
Longendyke R, Grundman JB, Majidi S. Acute and Chronic Adverse Outcomes of Type 1 Diabetes. Endocrinol Metab Clin North Am. 2024;53(1):123-133. doi:10.1016/j.ecl.2023.09.004
Heald AH, Stedman M, Davies M, et al. Estimating life years lost to diabetes: outcomes from analysis of National Diabetes Audit and Office of National Statistics data. Cardiovasc Endocrinol Metab. 2020;9(4):183-185. Published 2020 Jun 2. doi:10.1097/XCE.0000000000000210
Parker ED, Lin J, Mahoney T, et al. Economic Costs of Diabetes in the U.S. in 2022. Diabetes Care. 2024;47(1):26-43. doi:10.2337/dci23-0085
Persson S, Gerdtham UG, Steen Carlsson K; Swedish Childhood Diabetes Study Group. Labor market consequences of childhood onset type 1 diabetes. Econ Hum Biol. 2016;23:180-192. doi:10.1016/j.ehb.2016.09.003
Jahromi MM, Eisenbarth GS. Genetic determinants of type 1 diabetes across populations. Ann N Y Acad Sci. 2006;1079:289-299. doi:10.1196/annals.1375.044
Paterson AD, Waggott D, Boright AP, et al. A genome-wide association study identifies a novel major locus for glycemic control in type 1 diabetes, as measured by both A1C and glucose. Diabetes. 2010;59(2):539-549. doi:10.2337/db09-0653
Tisch R, McDevitt H. Insulin-dependent diabetes mellitus. Cell. 1996;85(3):291-297. doi:10.1016/s0092-8674(00)81106-x
Pang H, Lin J, Luo S, et al. The missing heritability in type 1 diabetes. Diabetes Obes Metab. 2022;24(10):1901-1911. doi:10.1111/dom.14777
Zheng Z, Liu S, Sidorenko J, et al. Leveraging functional genomic annotations and genome coverage to improve polygenic prediction of complex traits within and between ancestries. Nat Genet. 2024;56(5):767-777. doi:10.1038/s41588-024-01704-y
Widen E, Lello L, Raben TG, et al. Polygenic health index, general health, and pleiotropy: sibling analysis and disease risk reduction. Sci Rep. 2022;12:18173. doi:10.1038/s41598-022-22637-8
Raben TG, Lello L, Widen E, Hsu SDH. Efficient blockLASSO for polygenic scores with applications to all of us and UK Biobank. BMC Genomics. 2025;26(1):302. Published 2025 Mar 27. doi:10.1186/s12864-025-11505-0
Sharp SA, Rich SS, Wood AR, et al. Development and Standardization of an Improved Type 1 Diabetes Genetic Risk Score for Use in Newborn Screening and Incident Diagnosis. Diabetes Care. 2019;42(2):200-207. doi:10.2337/dc18-1785
As of 10/01/2025, Orchid’s T1D predictive performance comparison misleads in at least four important ways:
Orchid’s model does not show evidence of greater T1D stratification than the predictor constructed by Sharp et al. (2019) as 0.904 < 0.92.
Inclusion of age as an additional covariate is expected to inflate the overall AUC relative to one relying only on the genetic information available in PGT-P (see “Orchid’s Reported Performance for Alzheimer’s and Other Traits is Misleading” for further discussion). The same holds for genetic ancestry as measured by principal components (PCs).
Both Orchid and Sharp et al.’s model AUCs shown in the table below were in fact estimated in the same dataset, the UK Biobank. Sharp et al. state that “The ROC AUC increased from 0.886 to 0.927, P < 0.0001, in the T1DGC discovery data set and from 0.893 to 0.921 in the UK Biobank validation P < 0.0001 (Fig. 2C and F).”
It is unclear whether the comparison with Sharp et al.’s predictor is informative in the first place as Orchid uses an identical T1D GWAS and a near-identical construction method as does Sharp et al. The two models may be essentially the same excepting the exclusion of effects from three SNPs in Orchid’s version.